A Comprehensive Guide to Selecting Variants for Powerful Rare Variant Analysis
This article provides a definitive guide for researchers and drug development professionals on selecting and analyzing rare genetic variants.
A Comprehensive Guide to Selecting Variants for Powerful Rare Variant Analysis
Abstract
This article provides a definitive guide for researchers and drug development professionals on selecting and analyzing rare genetic variants. We cover the foundational principles of rare variants and their role in explaining 'missing heritability' in complex diseases. The guide delves into state-of-the-art methodological approaches, including burden, SKAT, and combined tests, alongside practical software implementation with tools like RVTESTS. It also addresses critical troubleshooting and optimization strategies for challenges like population stratification and power limitations. Finally, we explore validation techniques and comparative analyses, highlighting the impact of large biobank studies and emerging AI models that are accelerating rare disease diagnosis and therapeutic development.
Understanding Rare Variants: From Biology to Analysis Rationale
Variant Spectrum: Definitions and Analysis Methods
Quantitative Definitions of Variant Classes
The classification of genetic variants is primarily based on their Minor Allele Frequency (MAF) within a population. The table below summarizes the standard quantitative thresholds for each class.
| Variant Class | Minor Allele Frequency (MAF) | Key Characteristics |
|---|---|---|
| Ultra-Rare | < 0.1% (MAF < 0.001) | Often recent in origin, can have large phenotypic effects, may be family-specific or de novo [1] [2]. |
| Rare | 0.1% - 1% (0.001 ≤ MAF < 0.01) | Contributes to severe Mendelian disorders and complex traits; analysis often requires large sample sizes [3] [4]. |
| Low-Frequency | 1% - 5% (0.01 ≤ MAF < 0.05) | Serves as a bridge between rare and common variation; can be identified via genotyping arrays [4] [2]. |
Core Methodologies for Rare Variant Analysis
Choosing the correct statistical approach is crucial for well-powered rare variant association studies. The following table outlines the primary classes of methods used.
| Method Class | Core Principle | Best Use Case |
|---|---|---|
| Burden Tests | Collapses multiple variants within a region (e.g., a gene) into a single combined score, assuming all variants influence the trait in the same direction [4] [2]. | Ideal when you have prior evidence that most rare variants in your gene-set are deleterious. |
| Variance Component Tests (e.g., SKAT) | Tests for the cumulative effect of multiple variants but allows for both risk-increasing and protective variants within the same set [4] [2]. | Superior when the genetic region likely contains variants with mixed effects on the trait. |
| Combination Tests (e.g., SKAT-O) | A hybrid approach that blends burden and variance component tests to optimize power across different scenarios [4] [2]. | A robust default choice when the true genetic architecture of the trait is unknown. |
Experimental Protocols for Rare Variant Research
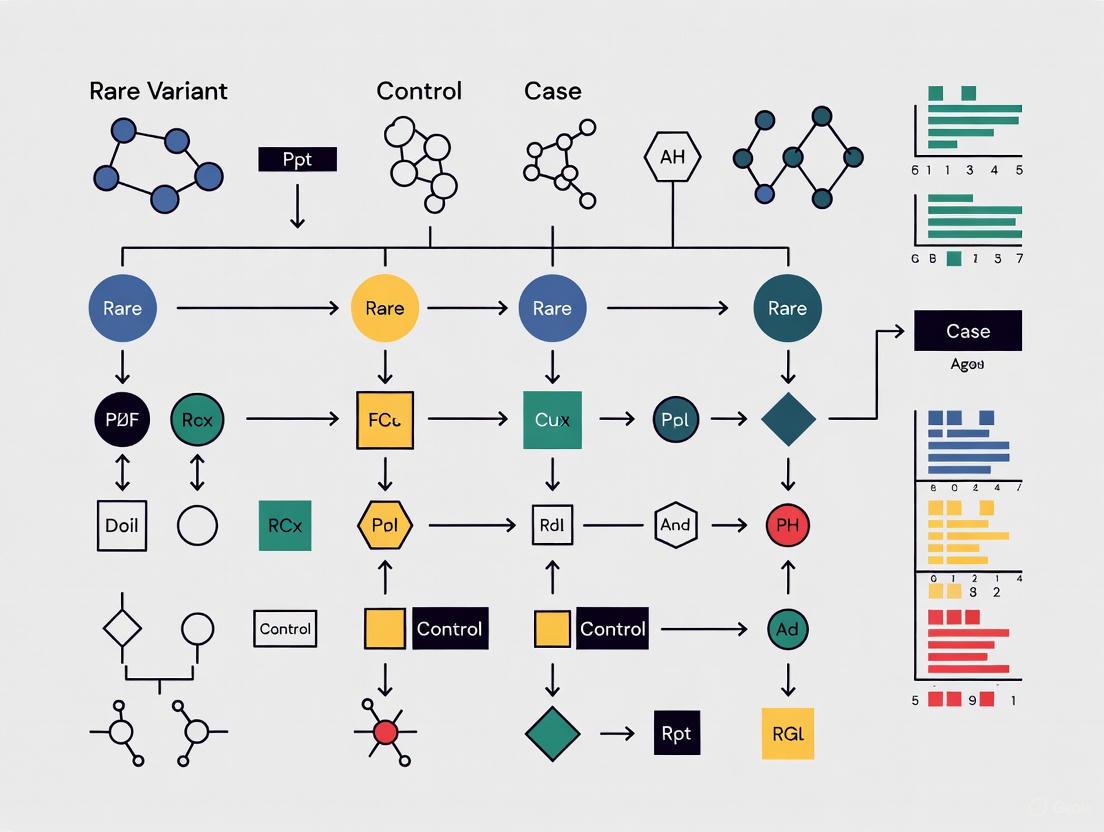
Workflow for an Integrated Rare Variant Association Study
The following diagram illustrates a comprehensive workflow for a rare variant study, from initial sequencing to functional validation.
Detailed Methodological Steps
Sequencing and Variant Discovery: The process typically begins with whole-exome sequencing (WES) or whole-genome sequencing (WGS). For WES, library preparation uses probes to capture protein-coding regions, which are then sequenced on platforms like the Illumina NovaSeq6000. Subsequent variant calling is performed using established pipelines like the GATK best practices for mapping and annotation [5]. For focused studies, targeted-region sequencing is a cost-effective alternative [4].
Variant Annotation and Filtering: Identified variants are annotated using tools like ANNOVAR or Variant Effect Predictor (VEP). Key filtering steps include:
- Frequency-based filtering: Removing variants that are too common to be likely drivers of a rare disease, using population databases like gnomAD [6] [7].
- Quality and depth filtering: Ensuring high-confidence variant calls.
- Functional impact prediction: Using in silico tools to predict if a variant is disruptive (e.g., protein-truncating variants) [7].
Rare Variant Association Analysis: This involves testing for an excess of rare variants in cases versus controls within pre-defined genomic units, most commonly genes.
- Defining Variant Sets: Variants are grouped by gene or functional unit. For case-control studies, a binary trait (e.g., severe vs. mild COVID-19) is defined [5].
- Choosing a Statistical Test: Apply burden, variance component (like SKAT), or combination tests (like SKAT-O) as described in the methods table above [4] [2].
- Accounting for Covariates: Regression-based models are used to adjust for confounding factors such as age, sex, and genetic ancestry (population structure), which is particularly important for rare variants [5] [2].
Variant Interpretation and Prioritization: Significant variants or genes from the association analysis must be interpreted for potential pathogenicity. This is guided by frameworks like the ACMG-AMP guidelines, which classify variants as Benign, Likely Benign, Variant of Uncertain Significance (VUS), Likely Pathogenic, or Pathogenic [6] [7]. This process integrates multiple lines of evidence, including population data, computational predictions, and functional data.
Decision Pathway for Selecting a Rare Variant Test
Selecting the most appropriate statistical test is a critical step. This decision pathway helps guide researchers based on their hypotheses about the genetic architecture of their trait of interest.
Troubleshooting Guides and FAQs
FAQs: Experimental Design and Analysis
Q: What is the most critical factor for a well-powered rare variant study? A: Sample size is paramount. Because individual rare variants are, by definition, found in very few individuals, extremely large cohorts (often tens of thousands of participants) are required to achieve sufficient statistical power to detect associations [2].
Q: How can I control for population stratification in rare variant studies? A: Population structure is a greater confounder for rare variants, which can be recent and population-specific. Standard methods include using Principal Component Analysis (PCA) or linear mixed models. However, these may be less effective for ultra-rare variants, and specialized methods that incorporate finer population structure are sometimes needed [4] [2].
Q: What should I do if my rare variant analysis identifies a gene with a significant association, but it contains many variants? A: This is a common challenge. Follow-up prioritization is essential. Focus on variants with the highest predicted functional impact (e.g., protein-truncating variants), those that are ultra-rare, and those located in functional domains critical to the gene. Integration with functional annotations and AI-based pathogenicity prediction models like popEVE can help identify the most likely causal variants [8].
Troubleshooting Common Sequencing Preparation Issues
Library preparation is a frequent source of error in sequencing-based studies. The table below outlines common problems and their solutions.
| Problem | Failure Signals | Root Cause | Corrective Action |
|---|---|---|---|
| Low Library Yield | Low concentration; faint/smeared electropherogram peaks [9]. | Degraded DNA/RNA; sample contaminants; inaccurate quantification [9]. | Re-purify input sample; use fluorometric quantification (Qubit) over UV; verify fragmentation parameters [9]. |
| Adapter Dimer Contamination | Sharp peak at ~70-90 bp in Bioanalyzer output [9]. | Excess adapters; inefficient ligation; overly aggressive purification [9]. | Titrate adapter-to-insert ratio; optimize ligation conditions; use bead-based cleanup with correct ratios [9]. |
| Low Library Complexity / High Duplication | High rate of PCR duplicates in sequencing data; overamplification artifacts [9]. | Too few PCR cycles; insufficient input DNA; PCR inhibitors [9]. | Increase input DNA if possible; optimize PCR cycle number; ensure clean sample input without inhibitors [9]. |
The Scientist's Toolkit: Essential Research Reagents and Materials
The following table details key reagents, tools, and databases that are essential for conducting rare variant analysis.
| Tool / Reagent | Function in Research | Specific Examples |
|---|---|---|
| Sequencing Kits | Prepare genetic material for sequencing on NGS platforms. | Illumina Exome Panel, TruSeq DNA PCR-free kit [5]. |
| Variant Caller | Identify genetic variants from raw sequencing data. | GATK, DRAGEN pipeline [5]. |
| Population Database | Determine variant frequency to filter common polymorphisms. | gnomAD, 1000 Genomes Project [6] [7]. |
| Variant Annotator | Add functional, conservation, and pathogenic information to variants. | ANNOVAR, Variant Effect Predictor (VEP) [5] [6]. |
| Pathogenicity Predictor | Computational prediction of a variant's deleteriousness. | In-silico tools (e.g., SIFT, PolyPhen); AI models (e.g., EVE, popEVE) [8] [7]. |
| Clinical Variant Database | Access curated information on variant-disease associations. | ClinVar, ClinVar, CIViC [6]. |
| Rare Variant Analysis Software | Perform burden, SKAT, and other association tests. | R packages (e.g., SKAT, CAST); SAIGE-GENE [4]. |
Frequently Asked Questions (FAQs)
Q1: How does purifying selection influence the allele frequency of variants in genetic databases? Purifying selection acts against deleterious genetic variants, removing them from the population over time. Consequently, variants with high penetrance and strong detrimental effects are kept at very low frequencies. In large genetic databases like gnomAD, you will observe a strong negative correlation between variant pathogenicity scores (e.g., CADD scores) and their allele frequency. Highly scored (likely deleterious) variants are overwhelmingly rare or even singletons (found in only one individual), whereas neutral variants are common. This principle allows researchers to use allele frequency as a proxy for variant deleteriousness, with rare variants being enriched for functional impact. [10]
Q2: What are the key statistical challenges in rare variant association studies (RVAS) and how can they be addressed? RVAS face distinct challenges compared to common variant studies. The table below summarizes the main issues and common solutions. [2] [4]
Table 1: Key Challenges and Solutions in Rare Variant Analysis
| Challenge | Description | Recommended Solutions |
|---|---|---|
| Low Statistical Power | Single-variant tests are underpowered due to very low Minor Allele Frequency (MAF). | Use gene-based or region-based aggregative tests (e.g., burden tests, SKAT) that combine multiple variants. [2] |
| Multiple Testing Burden | The number of rare variants is vastly greater than common variants. | Aggregate variants in predefined units (genes, pathways); use sliding-window approaches for non-coding regions. [2] [4] |
| Population Stratification | Rare variants can be recent and reflect fine-scale population structure, causing false positives. | Use methods that account for relatedness (e.g., SAIGE-GENE), include more principal components, or use family-based designs. [2] [4] |
| Allelic Heterogeneity | Causal variants within a gene may have opposing effects (risk vs. protective). | Use variance-component tests like SKAT or combination tests like SKAT-O, which are robust to mixed effect directions. [2] [4] |
Q3: What is the difference between a burden test and a variance-component test for rare variant analysis? These are two primary classes of gene-based aggregative tests, and they make different assumptions about the variants being analyzed: [2] [4]
- Burden Tests: These tests collapse rare variants within a gene into a single "burden score" (e.g., a count of rare alleles per individual). They assume all causal variants in the set influence the trait in the same direction and with similar magnitude. Examples include the Cohort Allelic Sums Test (CAST) and weighted-sum tests. [2]
- Variance-Component Tests (e.g., SKAT): These tests model the effects of individual variants as random effects, allowing for the presence of both risk and protective variants within the same gene set. They do not require assumptions about the direction of effect and are therefore more robust when such heterogeneity exists. [2] [4]
Q4: How can I optimize variant prioritization tools for rare disease research? Tools like Exomiser and Genomiser, which integrate genotypic and phenotypic data, are central to rare disease diagnosis. Performance is highly dependent on parameter optimization. A 2025 study on Undiagnosed Diseases Network data demonstrated that optimizing parameters—such as the choice of variant pathogenicity predictors, frequency filters, and the quality/quantity of Human Phenotype Ontology (HPO) terms—can dramatically improve diagnostic yield. For instance, optimizing Exomiser increased the percentage of coding diagnostic variants ranked in the top 10 from 49.7% to 85.5% for genome sequencing data. Always use comprehensive, high-quality HPO terms for the proband for best results. [11]
Q5: When should I consider the presence of structural variants (SVs) in my analysis? You should suspect SVs, which include deletions, duplications, inversions, and translocations, in cases where a strong clinical suspicion exists but no causative single-nucleotide variant or small indel has been found. While long-read sequencing is the gold standard for SV detection, novel bioinformatics pipelines can now identify complex SVs from standard short-read whole-genome sequencing data. One such study identified diagnostic SVs in 145 children, about half of whom had variants difficult to detect with other genetic tests. If your initial analysis is negative, consider a dedicated SV analysis, as SVs contribute significantly to rare diseases. [12]
Troubleshooting Guides
Problem 1: Inadequate Statistical Power in Rare Variant Association Analysis
Symptoms:
- No variants or genes reach statistical significance despite a strong prior hypothesis.
- Manually inspected variants appear compelling but do not pass stringent significance thresholds.
Investigation and Solutions:
- Verify Study Design and Sampling:
- Action: Consider using an extreme-phenotype sampling strategy, which enriches for rare variants by selecting individuals at the tails of a trait distribution. This can increase power while reducing sequencing costs. [4]
- Action: For family-based studies, ensure you are using statistical methods robust to relatedness, such as the Transmission Disequilibrium Test (TDT) or family-based association tests (FBATs). [4]
- Re-evaluate Your Association Testing Strategy:
- Action: If you suspect all rare variants in your gene of interest are deleterious, switch to a burden test.
- Action: If you suspect a mix of risk and protective variants, or variants with highly variable effect sizes, use a variance-component test like SKAT or a combined test like SKAT-O. [2] [4]
- Action: For very large sample sizes (N > 40,000) with binary traits, use a scalable method like SAIGE-GENE to control type I error rates effectively. [4]
- Incorporate Functional Annotations:
Problem 2: High-Ranking Candidate Variants are False Positives or Not Causative
Symptoms:
- Top variants from prioritization tools are common in the general population or are not de novo in a family trio.
- A candidate variant fails to segregate with the disease in a family.
Investigation and Solutions:
- Scrutinize Population Frequency Filters:
- Validate Segregation and De Novo Status:
- Action: For family studies, always confirm the inheritance pattern. A reported de novo variant should be absent in both biological parents. Use trio sequencing to definitively establish inheritance. [13] [11]
- Action: Check that the variant co-segregates with the disease in larger families, if available. A lack of perfect segregation is a strong indicator against pathogenicity for a highly penetrant variant.
- Check for Population Stratification:
Problem 3: Diagnostic Dead End in a Rare Mendelian Disease Case
Symptoms:
- Comprehensive exome or genome sequencing has been performed.
- All obvious candidate variants (e.g., in known disease genes) have been ruled out.
Investigation and Solutions:
- Reanalyze with Optimized Prioritization Parameters:
- Action: Systematically optimize your variant prioritization tool. As demonstrated in a 2025 study, adjusting parameters in Exomiser/Genomiser for gene-phenotype associations and pathogenicity scores can recover previously missed diagnostic variants, boosting top-10 rankings by over 35%. [11]
- Expand Search to Non-Coding Regions:
- Action: Use tools like Genomiser that are specifically designed to prioritize regulatory variants in non-coding regions. This is crucial when a coding variant is found on only one allele for a recessive disease. [11]
- Initiate a Structural Variant (SV) Analysis:
- Action: Re-analyze your WGS data with a dedicated SV-calling pipeline. As one study showed, ~8% of pathogenic SVs are complex, involving multiple changes that are easily missed by standard variant callers. [12]
- Request Reanalysis of Raw Data:
- Action: Many clinical and research labs offer no-cost reanalysis of existing sequencing data within a certain timeframe (e.g., 3 years). Periodic reanalysis can yield a diagnosis as knowledge bases and methods improve. [14]
The Scientist's Toolkit: Essential Research Reagents and Materials
Table 2: Key Resources for Rare Variant Research
| Resource Category | Specific Examples | Function and Application |
|---|---|---|
| Variant Prioritization Software | Exomiser, Genomiser, AI-MARRVEL [11] | Integrates genotype, phenotype (HPO terms), and inheritance to rank candidate variants. |
| Variant Pathicity Predictors | CADD (Combined Annotation Dependent Depletion), ReMM [10] [11] | Provides a genome-wide score predicting the deleteriousness of a variant. ReMM is specialized for non-coding regulatory variants. |
| Population Frequency Databases | gnomAD, ALFA, TOPMed [10] | Provides allele frequency data across diverse populations to filter out common polymorphisms. |
| Phenotype Ontology | Human Phenotype Ontology (HPO) [11] | A standardized vocabulary for clinical features, essential for computational phenotype-driven analysis. |
| Rare Variant Association Tests | SKAT/SKAT-O, Burden Tests, SAIGE-GENE [2] [4] | Statistical packages for performing gene-based or region-based aggregative tests for rare variants. |
Experimental Protocols & Workflows
Protocol 1: A Workflow for Case-Control Rare Variant Association Analysis
This protocol outlines a standard analytical workflow for identifying genes enriched for rare variants in a case-control cohort.
1. Preprocessing and Quality Control (QC)
- Variant Calling: Perform whole-genome or whole-exome sequencing on all cases and controls. Jointly call variants across all samples to ensure consistent genotypes.
- Variant QC: Apply standard filters for call rate, depth, and genotype quality. Remove technical outliers.
- Sample QC: Check for relatedness and genetic sex mismatches. Remove duplicate samples.
2. Variant Filtering and Annotation
- Define "Rare": Set a Minor Allele Frequency (MAF) threshold (e.g., < 0.01 or < 0.001) based on your sample size and study power. [2]
- Annotate Variants: Use a tool like ANNOVAR or VEP to annotate variants with functional consequences (e.g., missense, loss-of-function, splice-site) and population frequencies from databases like gnomAD.
- Select Variant Set: Focus on potentially functional variants, such as loss-of-function (LoF), missense, and splice-site variants. You may choose to include non-coding variants if using WGS data.
3. Gene-Based Association Testing
- Choose a Test:
- Account for Covariates: Include relevant covariates like age, sex, and genetic principal components (PCs) to control for population stratification.
4. Interpretation and Validation
- Multiple Testing Correction: Apply a multiple testing correction method (e.g., Bonferroni, FDR) to the gene-based p-values.
- Replication: If possible, attempt to replicate top association signals in an independent cohort.
- Functional Validation: Plan downstream functional experiments (e.g., in vitro assays, animal models) for the most promising candidate genes.
The following diagram illustrates the core logical workflow for this analysis.
Protocol 2: A Diagnostic Variant Prioritization Workflow for Rare Mendelian Disease
This protocol is designed for diagnosing an individual proband or family using sequencing data.
1. Data Input and Preparation
- Sequencing Data: Obtain a VCF file from the proband's exome or genome sequencing. Trio sequencing (proband + parents) is highly recommended.
- Phenotype Data: Create a comprehensive list of the proband's clinical features using precise Human Phenotype Ontology (HPO) terms. [11]
- Pedigree File: Prepare a PED file specifying the family structure and affected status.
2. Run Variant Prioritization Tool (Exomiser/Genomiser)
- Input Files: Provide the VCF, HPO list, and PED files to Exomiser.
- Parameter Optimization: Based on recent evidence, use optimized parameters for:
- Variant pathogenicity predictors: CADD v1.6/1.7.
- Frequency filters: Use stringent cutoffs (e.g., MAF < 0.001).
- Inheritance modes: Analyze all plausible modes (e.g., autosomal dominant, recessive, X-linked, de novo). [11]
3. Candidate Evaluation
- Review Top Candidates: Manually inspect the top 10-30 ranked variants/genes from the Exomiser output.
- Check Guidelines: Evaluate candidate variants according to established clinical guidelines (e.g., ACMG-AMP) for pathogenicity.
- Segregation Analysis: Confirm that the variant's inheritance pattern in the family matches the suspected disease model.
4. Complementary and Secondary Analyses
- Run Genomiser: If no causal variant is found, run Genomiser to search for non-coding regulatory variants. [11]
- Structural Variant Analysis: If the above steps are negative, perform a dedicated structural variant analysis on the WGS data. [12]
- Reanalysis: Schedule periodic reanalysis of the raw data, as new disease genes and variant interpretations are continuously discovered. [14]
The diagnostic journey, from initial testing to a potential result, is summarized in the workflow below.
Solving the 'Missing Heritability' Problem in Complex Traits
Key Evidence: The Role of Rare Variants
The following table summarizes the key quantitative evidence from recent large-scale studies on the contribution of rare genetic variants to complex trait heritability.
| Evidence Source | Sample Size & Data | Key Finding on Rare Variants | Proportion of WGS-based Heritability |
|---|---|---|---|
| Heritability Mapping Study [15] | 347,630 WGS individuals; 34 phenotypes | On average, rare variants (MAF < 1%) account for 20% of WGS-based heritability. | 20% from rare variants; 68% from common variants |
| Heritability Mapping Study [15] | 347,630 WGS individuals; 34 phenotypes | Of the rare-variant heritability, ~79% is attributed to non-coding variants. | 21% coding, 79% non-coding (of the rare-variant component) |
| Rare Variant Risk Study [16] | 454,712 exomes; 90 phenotypes | Rare, penetrant mutations in GWAS-implicated genes confer ~10-fold larger effects than common variants in the same genes. | N/A (Effect size comparison) |
Frequently Asked Questions: Troubleshooting Your Rare Variant Analysis
Question: Our rare variant meta-analysis shows inflated type I error rates for low-prevalence binary traits. How can we fix this?
Answer: Type I error inflation is a common challenge in meta-analysis of binary traits with case-control imbalance, such as low-prevalence diseases [17].
- Recommended Solution: Implement the Meta-SAIGE method. It employs a two-level saddlepoint approximation (SPA) to accurately estimate the null distribution [17].
- Level 1: SPA is applied to the score statistics within each individual cohort.
- Level 2: A genotype-count-based SPA is used for the combined score statistics across all cohorts in the meta-analysis [17].
- Experimental Protocol:
- Per-cohort preparation: Use SAIGE to generate per-variant score statistics (S) and their variances for each cohort. Simultaneously, generate a sparse linkage disequilibrium (LD) matrix (Ω) for the regions to be tested [17].
- Summary statistic combination: Combine score statistics from all cohorts. The covariance matrix is calculated as ( \text{Cov}(S) = V^{1/2} \text{Cor}(G) V^{1/2} ), where ( \text{Cor}(G) ) is derived from the LD matrix and ( V ) is the variance from the SPA-adjusted P values [17].
- Gene-based testing: Conduct Burden, SKAT, and SKAT-O tests on the combined summary statistics using the same approach as SAIGE-GENE+ [17].
Answer: Yes, you can leverage methods that reuse computational components across phenotypes.
- Recommended Solution: Adopt the Meta-SAIGE framework, which is designed for computational efficiency in phenome-wide analyses [17].
- Efficiency Protocol:
- Reuse the LD Matrix: Meta-SAIGE uses a sparse LD matrix that is not phenotype-specific. This same LD matrix, once computed for a cohort, can be reused across hundreds or thousands of different phenotypes [17].
- Storage Optimization: For meta-analyzing M variants from K cohorts for P phenotypes, this approach requires (O(MFK + MKP)) storage. In contrast, methods requiring phenotype-specific LD matrices (e.g., MetaSTAAR) need (O(MFKP + MKP)) storage, which is substantially larger [17].
Question: How can we improve the statistical power of our rare variant burden tests?
Answer: Power in burden tests is highly dependent on accurately classifying which rare variants are likely to be functional.
- Recommended Solution: Integrate advanced in-silico pathogenicity predictors into your variant prioritization strategy.
- Experimental Protocol:
- Apply a High-Performance Predictor: Use a tool like PrimateAI-3D, a deep learning-based classifier trained on evolutionary data from primate species. Integrate its scores into your burden testing pipeline [16].
- Benchmark the Improvement: Compare gene discovery rates with and without the predictor. In one study, using PrimateAI-3D improved gene discovery by 73% (1,285 more associations) at the same false discovery rate (FDR) [16].
- Validate Associations: Confirm that the newly discovered gene-phenotype pairs are enriched for genes implicated by GWAS and genes known for related Mendelian diseases, supporting their biological relevance [16].
The Scientist's Toolkit: Essential Reagents & Solutions
The table below lists key resources for designing and conducting a robust rare variant analysis study.
| Tool / Resource | Category | Primary Function | Key Application in Research |
|---|---|---|---|
| Meta-SAIGE [17] | Software | Rare variant meta-analysis | Scalable meta-analysis that controls type I error for binary traits and boosts efficiency via LD matrix reuse. |
| PrimateAI-3D [16] | Pathicity Predictor | Prioritizes deleterious missense variants | Increases power in burden tests by correctly weighting pathogenic variants; correlates with effect size and age of onset. |
| SAIGE/SAIGE-GENE+ [17] | Software | Rare variant association testing | Provides accurate per-cohort summary statistics and P values, adjusting for case-control imbalance and sample relatedness. |
| Ensembl VEP [18] | Annotation Tool | Predicts functional consequences of variants | Standardized annotation (e.g., stop-gained, splice-site) using Sequence Ontology terms; crucial for variant filtering and grouping. |
| Exome/Genome Array [19] | Genotyping Platform | Interrogates known coding variants | A cost-effective alternative to sequencing for genotyping a pre-defined set of rare exonic variants in very large samples. |
| DRAGEN Secondary Analysis [20] | Bioinformatic Pipeline | Accurate variant calling from NGS data | Provides highly accurate calling of SNVs, indels, and CNVs from whole-genome, whole-exome, or targeted sequencing data. |
Experimental Workflow: From Sequencing to Discovery
The diagram below outlines a robust workflow for a rare variant association study, from data generation through to meta-analysis and interpretation.
Analysis Workflow: Statistical Methods for Gene-Based Tests
Once summary data is prepared, the core of a rare variant association study involves applying specialized gene-based statistical tests. The diagram below illustrates the logical relationships between the main classes of tests.
Frequently Asked Questions (FAQs)
1. What is the key advantage of using extreme phenotype sampling for rare variant studies? Extreme phenotype sampling (EPS) significantly increases statistical power for detecting rare variant associations. This design enriches the sample with causal rare variants; individuals at the tails of a phenotypic distribution are more likely to carry these variants. One study found a much stronger association signal (P=0.0006) when using a sample of 701 phenotypic extremes compared to a sample of 1,600 randomly selected individuals (P=0.03) for the same trait and gene [21].
2. My rare variant association test has inflated type I error. What could be the cause? Type I error inflation is a common challenge, particularly for low-prevalence binary traits and in studies with highly unbalanced case-control ratios [17]. This can also occur due to population stratification, where rare variants can reflect fine-scale population structure that standard adjustment methods may not fully account for [2]. Using methods specifically designed to handle these issues, such as those employing saddlepoint approximations, is crucial [17].
3. Should I use a burden test or a variance-component test like SKAT for my analysis? The choice depends on the assumed genetic architecture of your trait:
- Burden tests are most powerful when most of the rare variants in your region are causal and their effects on the trait are in the same direction [4] [2].
- Variance-component tests (e.g., SKAT) are more robust and powerful when a large proportion of variants are non-causal or when causal variants have effects in opposite directions (e.g., both risk and protective) [4] [22].
- Combined tests (e.g., SKAT-O) offer a middle ground, often providing robust power across various scenarios [4] [22].
4. How can biobanks with linked electronic health records (EHRs) enhance rare variant studies? EHR-linked biobanks provide deep longitudinal clinical data on large cohorts, enabling researchers to:
- Define and validate phenotypes for a wide range of diseases using clinical codes, lab values, and medication records [23].
- Achieve large sample sizes necessary for well-powered rare variant analyses more efficiently and cost-effectively than prospective cohort studies [23].
- Study diverse populations and conditions that are often underrepresented in traditional research cohorts [23].
Troubleshooting Guides
Issue 1: Low Statistical Power in Rare Variant Association Analysis
Potential Causes and Solutions:
Cause: Inefficient Study Design.
- Solution: Implement an Extreme Phenotype Sampling (EPS) design. Power can be substantially greater in rare variant studies using EPS compared to random sampling [21] [22]. For continuous traits, use methods that analyze the full continuous phenotypic values rather than dichotomizing them, as this retains more information and increases power [22].
Cause: Small Sample Size for Rare Variants.
- Solution: Utilize large biobanks (e.g., UK Biobank, All of Us) that provide the scale needed [24] [23]. If a single cohort is insufficient, consider a meta-analysis to combine summary statistics from multiple studies. Methods like Meta-SAIGE are designed for this purpose and can achieve power comparable to analyzing pooled individual-level data [17].
Cause: Suboptimal Variant Filtering or Weighting.
- Solution: Incorporate variant functional annotations (e.g., predicted deleteriousness) to prioritize likely causal variants. Using informed variant weights in tests like SKAT or burden tests can also improve power [2].
Issue 2: Controlling False Positives (Population Stratification)
Problem: Rare variants can be recent and geographically localized, leading to confounding by fine-scale population structure [2].
Recommended Actions:
- Genetic Principal Components (PCs): Include a larger number of genetic PCs as covariates in your model compared to common variant analyses [4] [2].
- Linear Mixed Models (LMMs): Use methods that employ LMMs to account for sample relatedness and underlying structure. The SAIGE method and its derivatives (SAIGE-GENE, Meta-SAIGE) are specifically designed for this in the context of rare variants and binary traits [4] [17].
- Family-Based Designs: For robust control of confounding, consider family-based association tests (FBATs) or Transmission Disequilibrium Tests (TDTs), which are inherently robust to population stratification [4].
Issue 3: Analyzing Data from Multiple Cohorts (Meta-Analysis)
Challenge: Combining gene-based rare variant test results from different studies while controlling type I error and maintaining computational efficiency.
Step-by-Step Protocol using Modern Methods:
Preparation (Per Cohort):
- Use SAIGE to perform single-variant association analyses for each cohort. This generates per-variant score statistics (S) and their variances, accurately controlling for case-control imbalance and relatedness [17].
- Generate a sparse linkage disequilibrium (LD) matrix (Ω) for each gene or region of interest. Meta-SAIGE allows this LD matrix to be reused across all phenotypes, drastically reducing computational costs for phenome-wide analyses [17].
Summary Statistics Consolidation:
- Combine the per-variant score statistics and LD matrices from all contributing cohorts into a single superset.
- Apply the Genotype-Count-based SaddlePoint Approximation (GC-SPA) to the combined statistics. This step is critical for maintaining correct type I error rates for low-prevalence binary traits [17].
Gene-Based Association Testing:
- Perform Burden, SKAT, and SKAT-O tests on the combined summary statistics.
- Collapse ultrarare variants (e.g., those with a minor allele count < 10) to boost power and computation efficiency [17].
- Use the Cauchy combination method to combine P values from different functional annotations and MAF cutoffs for a final gene-based test result [17].
Research Reagent Solutions
Table: Key Resources for Rare Variant Association Studies
| Resource Name | Type | Primary Function in Research |
|---|---|---|
| UK Biobank [24] | Population Biobank | Provides deep genetic (genotyping, WES) and phenotypic data for ~500,000 individuals, enabling large-scale discovery. |
| All of Us [17] [23] | Population Biobank | Aims to build a diverse US cohort of >1M participants with genomic data and EHR linkages. |
| SAIGE / SAIGE-GENE+ [17] | Software Tool | Performs single-variant and gene-based rare variant tests, accurately controlling for case-control imbalance and sample relatedness. |
| Meta-SAIGE [17] | Software Tool | Conducts scalable rare variant meta-analysis using summary statistics from multiple cohorts, with accurate type I error control. |
| SKAT/SKAT-O [4] [22] | Statistical Method | A variance-component test for set-based rare variant association, robust to the presence of non-causal and opposite-effect variants. |
Experimental Workflow Diagrams
Study Design and Analysis Workflow
Meta-Analysis Computational Pipeline
Frequently Asked Questions (FAQs)
Q1: What are the key technological differences between WES, WGS, and genotyping arrays? Genotyping arrays probe a predefined set of hundreds of thousands of common variants across the genome. Whole Exome Sequencing (WES) targets and sequences the protein-coding regions (exons), which constitute about 1-2% of the genome. Whole Genome Sequencing (WGS) sequences the entire genome, capturing both coding and non-coding variation [25] [26] [27].
Q2: For rare variant analysis, should I use a single-variant test or a gene-based aggregation test? The choice depends on the underlying genetic architecture. Single-variant tests are generally more powerful for detecting associations with individual, high-impact rare variants. Gene-based aggregation tests (such as Burden or SKAT tests) pool signals from multiple rare variants within a gene and are more powerful only when a substantial proportion of the aggregated variants are causal and have effects in the same direction. The performance is strongly dependent on the sample size, region heritability, and the specific variant mask used (e.g., including only protein-truncating and deleterious missense variants) [28].
Q3: Does WGS offer a significant advantage over WES for discovering rare variant associations in large-scale studies? Current empirical evidence from large biobanks suggests that for a fixed sample size, the discovery yield for rare variant associations is very similar between WGS and a combined strategy of WES plus imputation from arrays (WES+IMP). Although WGS identifies about five times more total variants than WES+IMP, nearly half are singletons (variants found in only one individual) that are underpowered for association testing. The number of detected association signals for 100 complex traits differed by only about 1% between the two approaches [25] [27].
Q4: What is the primary advantage of a larger sample size versus a more comprehensive sequencing technology? Sample size is a critical driver of discovery power for rare variants. One study found that increasing the sample size for WES+IMP analysis from ~47,000 to ~468,000 individuals (a 10-fold increase) led to an approximately 20-fold increase in association signals. Given that WES+IMP is typically less expensive per sample than WGS, allocating resources to sequence a larger sample with WES+IMP can often yield more discoveries than sequencing a smaller sample with WGS [25] [27].
Q5: What is haplotype phasing and why is it important for rare variant analysis? Haplotype phasing involves distinguishing the two parentally inherited copies of each chromosome. This is crucial for identifying compound heterozygous events, where two different rare mutations knock out both copies of a gene, a common model for recessive rare diseases. Accurate phasing of rare variants enables the screening for such events in large cohorts [29].
Q6: When is WGS clearly preferred over WES in a clinical or research setting? WGS is preferred when the analysis requires the detection of variants in non-coding regions, such as regulatory elements or deep intronic regions, or for the comprehensive identification of structural variants. It is particularly valuable in rare disease diagnosis for families where WES has failed to provide a diagnosis, as it can uncover pathogenic non-coding variants that WES would miss [11] [26] [27].
Troubleshooting Guides
Problem 1: Inconclusive results from a genotyping array in a rare disease case.
- Potential Cause: Microarrays are designed to detect known common variants and large copy number variations (CNVs). They have limited resolution for small insertions/deletions (indels), cannot detect novel rare variants not on the array, and offer poor coverage of non-coding regions [30].
- Solution: Proceed to a sequencing-based test. Whole Exome Sequencing (WES) is a comprehensive next-step, as it can identify rare and novel single nucleotide variants (SNVs) and small indels in the coding regions where most known disease-causing variants are located [30].
Problem 2: Low statistical power in a rare variant association study.
- Potential Cause: The carrier count for individual ultra-rare variants is too low for single-variant tests to achieve statistical significance [28] [27].
- Solution:
- Employ gene-based aggregation tests: Collapse rare variants within a gene (e.g., all predicted loss-of-function variants) and test the combined burden of the gene. This increases power by effectively increasing the carrier count for the gene unit [28] [27].
- Increase sample size: Consider a meta-analysis to combine summary statistics from multiple cohorts. Methods like Meta-SAIGE are designed to control type I error rates and can achieve power comparable to a pooled analysis of individual-level data [17].
- Optimize the variant mask: Ensure you are aggregating variants most likely to be functional (e.g., protein-truncating and deleterious missense) to increase the proportion of causal variants in the test [28].
Problem 3: Difficulty interpreting the clinical significance of a prioritized rare variant.
- Potential Cause: A typical WES or WGS analysis generates a large number of rare variants, and manual review is time-consuming.
- Solution: Use a variant prioritization tool like Exomiser/Genomiser. Systematically evaluate the impact of key parameters for optimization [11]:
- Input high-quality phenotypic data: Provide a comprehensive and accurate set of the patient's clinical features using Human Phenotype Ontology (HPO) terms.
- Leverage gene-phenotype associations: Ensure the tool uses up-to-date databases linking genes to diseases.
- Apply appropriate variant pathogenicity predictors: Select and combine scores that are well-calibrated for your variant type (e.g., missense, non-coding).
- Incorporate family segregation data: When available, input genotype data from related affected and unaffected individuals to assess co-segregation with the disease.
Platform Comparison and Selection
Table 1: A quantitative comparison of data generation platforms based on UK Biobank analyses. [25]
| Feature | Genotyping + Imputation (IMP) | Whole Exome Sequencing (WES) | Whole Genome Sequencing (WGS) | WES + IMP (Combined) |
|---|---|---|---|---|
| Approximate Total Variants | ~111 million [25] | ~17 million [25] | ~599 million [25] | ~126 million [25] |
| Coding Variants | Limited to those in reference panel | ~10.5 million [25] | ~6.7 million [25] | ~6.8 million [25] |
| Variant Type | Common variants (MAF >0.1-1%) | Rare coding variants | Rare & common variants, coding & non-coding | Common genome-wide & rare coding variants |
| Singleton Proportion | Very Low | ~48% (of coding variants) [25] | ~47% (of all variants) [25] | ~7% (of all variants) [25] |
| Association Yield (100 traits in ~150k samples) | Lower than sequencing | Similar to WGS [25] | ~3,534 signals (baseline) [25] | ~3,506 signals (1% fewer than WGS) [25] |
Table 2: A functional comparison to guide platform selection. [31] [26] [30]
| Aspect | Genotyping Arrays | Whole Exome Sequencing (WES) | Whole Genome Sequencing (WGS) |
|---|---|---|---|
| Primary Strengths | Cost-effective for very large cohorts; excellent for common variant GWAS. | Focuses on coding regions (~85% of known disease variants); high depth enables sensitive rare variant calling; lower cost than WGS. | Comprehensive view; detects all variant types anywhere, including non-coding and structural variants. |
| Major Limitations | Limited to pre-defined variants; poor for rare/novel variants; cannot phase de novo. | Misses non-coding and regulatory variants; capture efficiency can lead to coverage gaps and biases. | High cost per sample; massive data storage/analysis burden; challenging interpretation of non-coding variants. |
| Ideal Use Case | Genome-wide association studies (GWAS) of common variants in large populations. | Identifying rare coding variants associated with complex diseases or finding causative mutations in Mendelian disorders. | Discovery of non-coding variants, comprehensive structural variant detection, and unresolved rare disease cases. |
Experimental Workflows and Protocols
Protocol 1: Accurate Phasing of Rare Variants in Large Cohorts using SHAPEIT5 [29]
Application: This protocol is used for haplotype phasing of large-scale whole-genome or whole-exome sequencing data, which is a prerequisite for analyses like compound heterozygous mutation screening and genotype imputation.
Methodology: SHAPEIT5 uses a three-stage approach to achieve high accuracy, especially for rare variants:
- Common Variant Phasing: Common variants (MAF > 0.1%) are first phased using an optimized SHAPEIT4 algorithm, which is highly accurate for common variants in large sample sizes. The resulting haplotypes form a "scaffold."
- Rare Variant Phasing: Each rare heterozygous variant (MAF < 0.1%) is phased onto the scaffold haplotypes using an imputation-based model. For a given rare variant, the method identifies a set of conditioning haplotypes that are (a) locally identical-by-descent (IBD) with the target sample and (b) carry the minor allele. The Li and Stephens model is then used to determine the most likely phase.
- Singleton Phasing: Singletons (variants with a minor allele count of 1) are phased using a coalescent-inspired model that leverages IBD sharing patterns. The model assumes singletons are recent mutations and assigns them to the target haplotype that shares the shortest IBD segment with others.
Protocol 2: Gene-Based Rare Variant Meta-Analysis with Meta-SAIGE [17]
Application: This protocol enables the meta-analysis of gene-based rare variant association tests (e.g., Burden, SKAT, SKAT-O) across multiple cohorts without sharing individual-level data. It is designed to control type I error rates effectively, even for low-prevalence binary traits.
Methodology:
- Step 1 - Cohort-Level Preparation: For each cohort, use SAIGE to generate per-variant score statistics (S) and their variances, accounting for sample relatedness and case-control imbalance. Also, generate a sparse linkage disequilibrium (LD) matrix (Ω) for variants in the gene/region. This LD matrix is not phenotype-specific and can be reused across different traits.
- Step 2 - Summary Statistics Combination: Combine the per-variant score statistics from all cohorts. For binary traits, apply a two-level saddlepoint approximation (SPA): first on the score statistics of each cohort, and then a genotype-count-based SPA on the combined statistics to ensure accurate type I error control.
- Step 3 - Gene-Based Testing: Perform gene-based Burden, SKAT, and SKAT-O tests using the combined score statistics and covariance matrix. Ultrarare variants (e.g., MAC < 10) can be collapsed to improve power and computation efficiency. Finally, use the Cauchy combination method to combine P values from different functional annotations and MAF cutoffs.
Table 3: Key software tools and resources for rare variant analysis.
| Tool Name | Primary Function | Application Context | Key Features / Notes |
|---|---|---|---|
| SHAPEIT5 [29] | Haplotype Phasing | WGS/WES data processing | Provides high accuracy for rare variants and singletons; essential for compound heterozygote detection. |
| Meta-SAIGE [17] | Rare Variant Meta-Analysis | Multi-cohort association studies | Controls type I error for unbalanced case-control traits; reuses LD matrices for computational efficiency. |
| SAIGE/SAIGE-GENE+ [17] | Single-Variant & Gene-Based Tests | Single-cohort association analysis | Uses SPA to control for case-control imbalance and sample relatedness in large biobanks. |
| Exomiser/Genomiser [11] | Variant Prioritization | Rare disease diagnosis | Ranks variants by integrating genotype, pathogenicity predictions, and patient HPO phenotype terms. |
| REGENIE [25] | Genome-Wide Association | Large-scale regression | Used for efficient single-variant and gene-based association tests on quantitative and binary traits. |
A Practical Pipeline for Rare Variant Association Testing
Variant Quality Control (QC) and Annotation Best Practices
Variant Quality Control (QC) and annotation form the critical foundation of rare variant analysis research, ensuring the accuracy and reliability of genetic findings. In rare disease research and drug development, stringent QC processes are essential for distinguishing true pathogenic variants from technical artifacts, while comprehensive annotation provides the biological context needed for clinical interpretation. This technical support center addresses common challenges researchers face during these processes and provides evidence-based solutions to improve diagnostic yield and research validity.
Troubleshooting Guides and FAQs
Why is my diagnostic variant not ranked highly by prioritization tools like Exomiser?
Problem: Diagnostic variants are ranked outside the top candidates in variant prioritization tools, potentially causing them to be missed during manual review.
Solutions:
- Optimize prioritization parameters: Systematically evaluate and adjust key parameters including gene-phenotype association data, variant pathogenicity predictors, and phenotype term quality. One study demonstrated that parameter optimization improved Exomiser's performance for genome sequencing data from 49.7% to 85.5% for top-10 ranking of coding diagnostic variants [11].
- Enhance phenotype data quality: Provide comprehensive, accurate Human Phenotype Ontology (HPO) terms. The number and quality of HPO terms significantly impact prioritization performance. Avoid randomly sampled or incomplete phenotype terms [11].
- Verify family data inclusion: Ensure proper inclusion and accuracy of family variant data in PED format files, as familial segregation patterns strengthen variant prioritization [11].
- Apply complementary tools: For cases with suspected regulatory variants, use Genomiser alongside Exomiser. One study showed optimization improved noncoding variant ranking in the top 10 from 15.0% to 40.0% [11].
How can I resolve memory errors during variant calling and annotation workflows?
Problem: Workflows encounter memory errors during aggregation steps, particularly for genes with high variant counts or longer genes.
Solutions:
- Increase memory allocation: For problematic genes (e.g., RYR2, SCN5A), adjust memory parameters as shown in the table below [32]:
Table 1: Memory Allocation Adjustments for Problematic Genes
| Workflow Component | Task | Default Memory | Adjusted Memory |
|---|---|---|---|
quick_merge.wdl |
split | 1GB | 2GB |
quick_merge.wdl |
firstroundmerge | 20GB | 32GB |
quick_merge.wdl |
secondroundmerge | 10GB | 48GB |
annotation.wdl |
filltagsquery | 2GB | 5GB |
annotation.wdl |
annotate | 1GB | 5GB |
annotation.wdl |
sumandannotate | 5GB | 10GB |
- Adjust CPU and queue settings: Increase CPU cores for computationally intensive tasks and use appropriate queue types (short vs. medium) based on job requirements [32].
- Monitor specific genes: Be particularly aware of known problematic genes including TNNI3, KIF1A, ACTN2, PRKAG2, RYR2, SCN5A, CRELD1, and BBS10, which often require additional resources [32].
Why does my autosomal variant show hemizygous calls (ACHemivariant > 0)?
Problem: Autosomal variants display haploid (hemizygous-like) calls despite not being on sex chromosomes.
Explanation and Solution:
- Understand the mechanism: These haploid calls indicate that the variant is located within a deletion on the other chromosome for the same sample. They originate from single-sample gVCFs, not the aggregation procedure [32].
- Review adjacent variants: Check for nearby deletions that might explain the haploid call pattern [32].
- Worked example: As illustrated in the table below, a haploid ALT call at position chr1:2118756 can be explained by a heterozygous 2bp deletion immediately upstream (chr1:2118754-2118755) [32]:
Table 2: Example of Haploid Calls from Adjacent Deletions
| CHROM | POS | REF | ALT | GT | Description |
|---|---|---|---|---|---|
| chr1 | 2118754 | TGA | T | 0/1 | 2bp deletion called as heterozygous |
| chr1 | 2118755 | G | . | 0 | Reference call, haploid due to deletion |
| chr1 | 2118756 | A | T | 1 | ALT call, haploid due to deletion |
What quality metrics should I check for SNP array data in quality control?
Problem: Determining which quality metrics and thresholds ensure reliable copy number variant (CNV) detection in SNP array data.
Solutions:
- Verify call rates: Maintain call rates between 95% and 98% for SNP array data. Call rate represents the percentage of SNPs successfully assigned a genotype out of the total probes on the array [33].
- Utilize B-allele frequency and log R ratio: These key values in GenomeStudio help detect chromosomal aberrations. B-allele frequency shows the allele ratio, while log R ratio indicates intensity deviations that suggest copy number changes [33].
- Detect copy-neutral LOH: Leverage SNP array's unique ability to identify copy-neutral loss of heterozygosity (CN-LOH), which cannot be detected by traditional G-banding [33].
- Combine with traditional methods: Use SNP array analysis alongside G-banding, which remains valuable for detecting balanced translocations and provides a whole-genome overview [33].
When should I use WGS instead of WES for rare variant detection?
Problem: Deciding between whole-genome sequencing (WGS) and whole-exome sequencing (WES) for optimal detection of diagnostically challenging variants.
Solutions:
- Select WGS for technically challenging variants: WGS demonstrates superior capability in detecting variants that are technically intractable to WES, including: variants in low-coverage regions with PCR bias, deep intronic variants, repeat expansions, structural variants, and variants in genes with homologous pseudogenes [34].
- Consider WGS as first-line testing: One study found that WGS provided causative variants in 42.9% of patients with high clinical suspicion of rare disorders, with 21.7% of these attributable to technically challenging variants missed by other methods [34].
- Implement comprehensive analysis: Employ PCR-free short-read WGS and comprehensive analytical pipelines to maximize variant detection across the entire genome [34].
- Evaluate diagnostic yield: Research shows WGS can serve as an all-in-one test for patients with high clinical suspicion of rare diseases, potentially ending diagnostic odysseys [34].
Experimental Protocols
Optimized Variant Prioritization Protocol Using Exomiser/Genomiser
Purpose: To systematically prioritize coding and noncoding variants in rare disease cases using optimized parameters.
Methodology:
- Input Preparation:
- Collect multi-sample family variant call format (VCF) files
- Prepare corresponding pedigree file in PED format
- Encode patient clinical presentations using Human Phenotype Ontology (HPO) terms
Parameter Optimization:
- Adjust gene-phenotype similarity algorithms
- Optimize variant pathogenicity score thresholds
- Set appropriate frequency filters based on population databases
- Configure mode of inheritance patterns
Execution and Refinement:
- Run Exomiser for coding variants and Genomiser for regulatory variants
- Apply p-value thresholds to refine outputs
- Flag genes frequently ranked in top 30 but rarely associated with diagnoses
- Combine results from both tools for comprehensive variant prioritization [11]
Standardized Clinical Bioinformatics Pipeline for WGS
Purpose: To ensure clinical consensus, accuracy, reproducibility, and comparability in diagnostic WGS.
Methodology:
- Data Processing:
- De-multiplex raw sequencing output (BCL to FASTQ)
- Align sequencing reads to reference genome hg38 (FASTQ to BAM)
Variant Calling:
- Call SNVs and small insertions/deletions (indels)
- Detect copy number variants (CNVs), structural variants (SVs), short tandem repeats (STRs)
- Identify loss of heterozygosity (LOH) regions indicating uniparental disomy (UPD)
- Call mitochondrial SNVs and indels using tailored approaches
Quality Assurance:
- Verify data integrity using file hashing
- Confirm sample identity through fingerprinting and genetically inferred markers
- Perform automated quality checks within the analysis pipeline
- Utilize standard truth sets (GIAB for germline, SEQC2 for somatic variant calling)
- Supplement with recall testing of real human samples previously tested with validated methods [35]
Table 3: Key Recommendations for Clinical Bioinformatics Production
| Category | Recommendation | Implementation Guidance |
|---|---|---|
| Reference Genome | Adopt hg38 genome build | Use as standard reference for all analyses |
| Variant Calling | Use multiple tools for structural variant calling | Complement standard SNV/indel calling with specialized SV callers |
| Quality Control | Implement in-house datasets for filtering recurrent calls | Maintain laboratory-specific artifact databases |
| Technical Standards | Operate at standards similar to ISO 15189 | Utilize off-grid clinical-grade high-performance computing systems |
| Reproducibility | Ensure containerized software environments | Use Docker or Singularity for consistent software versions |
| Data Integrity | Verify through file hashing and sample fingerprinting | Implement genetic relatedness checks and sex inference [35] |
Table 4: Performance Improvements Through Parameter Optimization in Exomiser
| Sequencing Type | Default Top-10 Ranking | Optimized Top-10 Ranking | Improvement |
|---|---|---|---|
| Genome Sequencing (Coding) | 49.7% | 85.5% | +35.8% |
| Exome Sequencing (Coding) | 67.3% | 88.2% | +20.9% |
| Noncoding Variants (Genomiser) | 15.0% | 40.0% | +25.0% [11] |
The Scientist's Toolkit
Table 5: Essential Research Reagent Solutions for Variant QC and Annotation
| Item | Function | Application Notes |
|---|---|---|
| Exomiser/Genomiser | Prioritizes coding and noncoding variants | Open-source; integrates allele frequency, pathogenicity predictions, HPO terms |
| GenomeStudio with cnvPartition | Analyzes SNP array data for CNV detection | User-friendly interface for researchers with minimal bioinformatics expertise |
| Global Screening Array v3.0 | SNP array platform for chromosomal aberration detection | Suitable for quality control of hPSCs; detects CNVs >350 kb |
| Clinical Genome Analysis Pipeline (CGAP) | Processes WGS/WES data in cloud environment | Compatible with Amazon Web Services; produces per-sample GVCF files |
| QIAamp DNA Blood Mini Kit | Extracts genomic DNA for SNP array processing | Provides high-quality DNA for accurate genotyping |
| Sentieon | Jointly calls variants across samples | Used for processing cohort-level sequencing data [11] [33] [35] |
Workflow Diagrams
Variant Analysis and QC Workflow
Rare Variant Analysis Framework
Frequently Asked Questions (FAQs)
1. What is the primary advantage of using gene-based analysis units over single-variant tests for rare variants? Gene-based analysis units aggregate multiple rare variants within a functional region, which increases statistical power. Single-variant tests for rare variants are often underpowered due to low minor allele frequencies, whereas methods like burden tests and SKAT combine evidence across multiple variants in a gene [36] [37]. Aggregation tests are particularly more powerful when a substantial proportion of the aggregated variants are causal and have effects in the same direction [28].
2. When should I consider using a sliding window approach instead of a gene-based unit? Sliding window approaches are particularly valuable for exploring associations in non-coding regions of the genome, where functional units are not as clearly defined as genes. This method systematically analyzes the genome in contiguous segments, allowing for the discovery of associations outside of known gene boundaries [38]. This is crucial in whole-genome sequencing studies for identifying novel, non-coding rare variant associations.
3. How does the choice of analysis unit impact the control of Type I error? The choice of analysis unit and the subsequent statistical method must account for data characteristics like case-control imbalance. For binary traits with low prevalence, some meta-analysis methods can exhibit inflated Type I error rates. Methods like Meta-SAIGE employ statistical adjustments, such as saddlepoint approximation, to accurately estimate the null distribution and control Type I error, regardless of the analysis unit used [17].
4. What are the common factors that lead to loss of power in gene-based burden tests? Power loss in burden tests typically occurs when the aggregated rare variants include a mix of causal variants with opposing effect directions (bidirectional effects) or when a significant number of neutral (non-causal) variants are included in the unit. This cancels out association signals and dilutes the statistical power [36] [28]. Careful variant selection through functional annotation is key to mitigating this.
5. How can functional annotations be integrated into the definition of analysis units? Functional annotations, such as predicting whether a variant is protein-truncating or deleterious, can be used to create more refined analysis units or to weight variants within a unit. For example, you can define a unit to include only protein-truncating variants (PTVs) and deleterious missense variants within a gene, which increases the prior probability that variants in the unit are causal and can boost power [28] [37]. Frameworks like STAAR and MultiSTAAR systematically integrate multiple functional annotations into association testing [38].
Troubleshooting Guides
Problem: Inflated Type I Error in Meta-Analysis of Binary Traits
Issue: When meta-analyzing rare variant associations for a low-prevalence binary trait (e.g., a disease with 1% prevalence), your results show an inflated Type I error rate, leading to false positive associations.
Solution:
- Root Cause: Standard meta-analysis methods can fail to accurately estimate the true null distribution when case-control ratios are highly imbalanced.
- Steps for Resolution:
- Utilize Robust Methods: Implement meta-analysis methods specifically designed to handle case-control imbalance. The Meta-SAIGE method, for example, employs a two-level saddlepoint approximation (SPA) to accurately estimate the null distribution [17].
- Apply Genotype-Count SPA: Ensure the method includes a genotype-count-based SPA for the combined score statistics from all cohorts in the meta-analysis. This additional adjustment is critical for controlling Type I error in low-prevalence settings [17].
- Verify with Simulation: If possible, conduct a small-scale simulation using your study's genotype data and phenotype structure to confirm that the chosen method controls Type I error adequately before proceeding with the full analysis.
Problem: Low Power in Gene-Based Aggregation Tests
Issue: Your gene-based rare variant association test is not identifying significant associations, despite a prior belief that a gene is involved.
Solution:
- Root Cause: Power is low because the aggregated variants contain many non-causal variants or causal variants with effects in opposite directions.
- Steps for Resolution:
- Refine Your Variant Mask: Instead of aggregating all rare variants, restrict your analysis unit to variants with a higher prior probability of being functional. Focus on protein-truncating variants (PTVs) and deleterious missense variants, using annotations from tools like popEVE [28] [39].
- Choose an Adaptive Test: Switch from a simple burden test to an omnibus test like SKAT-O or a method that combines p-values from different masks and tests (e.g., using the Cauchy combination method). These tests are more robust to the presence of non-causal variants and bidirectional effects [17] [40].
- Check Genetic Model Parameters: Use available resources (like the R Shiny app from [28]) to understand the power of aggregation tests under different assumptions. Power is strongly dependent on the proportion of causal variants (
c), the total number of variants (v), and the region-wide heritability (h2) [28].
Problem: Handling Population Structure and Relatedness in Large-Scale WGS
Issue: Analyses in large-scale whole-genome sequencing (WGS) studies, which often include related individuals or multiple ancestries, may yield spurious associations due to population stratification or cryptic relatedness.
Solution:
- Root Cause: Standard regression models assume individuals are unrelated, and violations of this assumption can inflate test statistics.
- Steps for Resolution:
- Use Mixed Models: Apply statistical frameworks that can account for sample relatedness. Methods like SAIGE and MultiSTAAR use generalized linear mixed models (GLMMs) that incorporate a genetic relationship matrix (GRM) to adjust for relatedness and population structure [17] [38].
- Incorporate Principal Components: Include leading principal components from genetic data as covariates in your model to control for broad-scale population structure [37].
- Employ Functional Informed Frameworks: For multi-trait analysis in diverse cohorts, use frameworks like MultiSTAAR that are explicitly designed to account for relatedness, population structure, and correlation among phenotypes simultaneously [38].
Methodological Comparison of Analysis Units
Table 1: Key characteristics and applications of different analysis units in rare variant studies.
| Analysis Unit | Definition | Best Use Cases | Common Statistical Tests | Key Considerations |
|---|---|---|---|---|
| Gene | Aggregates variants within the boundaries of a gene. | Testing the cumulative effect of rare variants on protein function; exome-wide association studies. | Burden, SKAT, SKAT-O [36] [37] | Power depends heavily on the proportion of causal variants within the gene [28]. |
| Pathway | Aggregates variants across multiple genes that share a common biological function. | Identifying subtle polygenic effects spread across a biological system; generating hypotheses on disease mechanisms. | Often uses gene-based p-value combination methods. | Requires well-annotated pathway databases; interpretation can be complex. |
| Sliding Window | Analyzes the genome in small, contiguous, and overlapping segments. | Discovering associations in non-coding regions; whole-genome sequencing studies without pre-defined hypotheses. | Burden, SKAT, STAAR [38] | Computationally intensive; requires careful multiple-testing correction. |
Table 2: Strategic selection of statistical tests for different genetic models within an analysis unit.
| Genetic Model Scenario | Recommended Test | Rationale |
|---|---|---|
| All or most aggregated rare variants are causal and have effects in the same direction. | Burden Test [28] [40] | Maximizes power by pooling effects, assuming a unidirectional model. |
| Mixture of causal and non-causal variants, or causal variants have effects in opposite directions. | Variance-Component Test (e.g., SKAT) [28] [40] | Robust to the inclusion of neutral variants and bidirectional effects. |
| The underlying genetic model is unknown (a common real-world scenario). | Omnibus Test (e.g., SKAT-O) [17] [37] | Adaptively combines burden and variance-component tests to achieve robust power across various scenarios. |
Experimental Protocols for Unit Definition
Protocol 1: Defining and Testing Gene-Based Units with Functional Annotations
This protocol outlines a standard workflow for conducting a gene-based rare variant association analysis, incorporating functional annotations to increase power.
- Variant Quality Control (QC): Start with high-quality sequencing or imputed data. Filter out variants with low call rate, deviation from Hardy-Weinberg equilibrium, or poor imputation quality [37].
- Variant Annotation: Annotate all variants using bioinformatics tools. Prioritize functional consequences (e.g., synonymous, missense, protein-truncating) and use pathogenicity prediction scores from tools like popEVE [39] [6].
- Define Gene Units and Masks: For each gene, create one or more "masks" (variant sets). A common strategy is to create masks for:
- All rare variants (MAF < 0.01).
- Only protein-truncating variants (PTVs).
- PTVs and deleterious missense variants.
- Association Testing: For each gene and mask, perform rare variant association tests. It is recommended to run an omnibus test like SKAT-O, which is robust to different genetic models [17].
- P-value Combination: If multiple masks were tested per gene, combine the p-values using a method like the Cauchy combination test to generate a single, aggregate p-value for the gene [17].
- Multiple Testing Correction: Apply a multiple testing correction (e.g., Bonferroni) across all tested genes to control the family-wise error rate.
Protocol 2: Conducting a Sliding Window Analysis in Non-Coding Regions
This protocol is designed for scanning the entire genome for rare variant associations outside of protein-coding genes.
- Define Window Parameters: Set the size of the window (e.g., 5 kb) and the step size (e.g., 2.5 kb). A smaller step size creates more overlap, reducing the chance of missing a signal at a window boundary.
- Tiling the Genome: Systematically slide the window across all autosomes and sex chromosomes, creating a comprehensive set of non-overlapping or overlapping analysis units [38].
- Variant Inclusion: Within each window, aggregate all rare variants (e.g., MAF < 0.01) that pass QC.
- Association Testing: Perform a rare variant association test (e.g., burden or SKAT) for each window. Computational efficiency is critical here due to the vast number of units tested.
- Functional Annotation of Significant Windows: For windows that show significant association, annotate the region using databases like ENCODE to check for regulatory elements (e.g., enhancers, promoters) that may indicate biological relevance [37].
- Multiple Testing Correction: Use a stringent multiple testing correction method, such as Bonferroni or a permutation-based approach, to account for the millions of tests performed.
Workflow Diagram for Analysis Unit Selection
Diagram 1: A workflow to guide the selection of analysis units and statistical tests based on study goals and genetic models.
Table 3: Key computational tools and data resources for defining and analyzing rare variant units.
| Resource Name | Type | Primary Function in Analysis |
|---|---|---|
| popEVE [39] | AI Prediction Tool | Scores each genetic variant for its likelihood of being disease-causing, enabling cross-gene comparison and variant prioritization for masks. |
| gnomAD [6] | Population Frequency Database | Provides allele frequency data across diverse populations to filter out common variants unlikely to cause rare diseases. |
| ClinVar [6] | Clinical Annotation Database | A public archive of reports on the relationships between human variants and phenotypes, with supporting evidence. |
| SKAT/SKAT-O [17] [37] | Statistical Test Software | R packages for performing powerful and flexible rare variant association tests for genes, regions, or windows. |
| Meta-SAIGE [17] | Meta-Analysis Software | A scalable tool for rare variant meta-analysis that controls Type I error and boosts computational efficiency. |
| ACMG-AMP Guidelines [6] | Classification Framework | A standardized system for interpreting the clinical significance of sequence variants (Pathogenic, VUS, Benign). |
Frequently Asked Questions
What is the fundamental principle behind a burden test? Burden tests operate on the core principle of aggregating, or "collapsing," multiple rare genetic variants within a gene or genomic region into a single burden score for each individual. This score is then tested for association with a trait or disease, under the assumption that the aggregated rare variants collectively influence the phenotype, typically in the same direction. This approach increases statistical power for detecting associations that would be too weak to detect with single-variant tests for very rare variants [41] [42] [43].
When should I choose a burden test over a single-variant test or SKAT? The choice of test depends heavily on the assumed genetic architecture of the trait [44] [43].
- Burden tests are most powerful when a substantial proportion of the aggregated rare variants are causal and their effects on the trait are in the same direction (e.g., all are deleterious). They can lose power if many variants are non-causal or if effects are bidirectional [45] [44].
- Single-variant tests are often more effective when only a very small number of rare variants in a region are causal [44].
- Variance-component tests like SKAT are more powerful when a large fraction of variants are non-causal or when causal variants have effects in different directions (both risk-increasing and protective) [45] [46]. Hybrid tests like SKAT-O were developed to combine the advantages of burden and SKAT, providing robust power across various scenarios [45] [17].
How do I define the variant set or "mask" for my burden test? Defining the variant set is a critical step. A "mask" specifies which variants to include based on criteria such as [44]:
- Variant Function: Prioritize variants with likely high impact on protein function, such as protein-truncating variants (PTVs) or putatively deleterious missense variants.
- Allele Frequency: Use a minor allele frequency (MAF) threshold (e.g., MAF < 0.01 or 0.001) to focus on rare variants. It is common to test multiple masks (e.g., PTVs only, PTVs + deleterious missense) across a range of frequency thresholds to explore different biological hypotheses [47].
I've heard burden tests can be sensitive to population stratification. How can I control for this? Population stratification is a major confounder. Best practices to address it include [41]:
- Covariate Adjustment: Include principal components (PCs) derived from genetic data as covariates in your regression model to account for ancestral differences.
- Genetic Relatedness Matrix: Use mixed models (as implemented in tools like REGENIE or SAIGE) that incorporate a genetic relatedness matrix to account for sample relatedness and fine-scale population structure [17].
- Calibration with Synonymous Variants: Using presumably benign synonymous variants to calibrate the test can help guard against false positives caused by technical artifacts or stratification [41].
What should I do if my burden test results are highly correlated across different masks? When testing multiple, highly correlated burden scores (e.g., the same annotation class at different frequency thresholds), interpretation and multiple testing correction can be challenging. One solution is to use methods that jointly test the set of burden scores. For example, the Sparse Burden Association Test (SBAT) uses a non-negative least squares approach to jointly model burden scores, which also induces sparsity and can aid in selecting the most relevant frequency bin and annotation class [47].
Troubleshooting Guides
Problem: Inflated Type I Error in Case-Control Studies
- Symptoms: Quantile-Quantile (Q-Q) plot shows genomic inflation (lambda >1). An unacceptable number of false positive associations are observed in negative control tests.
- Solution: This is a common issue in studies of binary traits, especially with low prevalence and case-control imbalance [17].
- Use Adjusted Methods: Employ software specifically designed to handle case-control imbalance. Meta-SAIGE uses a two-level saddlepoint approximation (SPA) to accurately estimate the null distribution and control type I error [17].
- Check LD Matrix Construction: If performing meta-analysis, ensure the linkage disequilibrium (LD) matrix is appropriately calculated. Using a single, study-wide sparse LD reference file that is rescaled for each phenotype can be both computationally efficient and accurate [48].
Problem: Low Power to Detect Associations
- Symptoms: Known associated genes do not appear significant in your analysis. Power calculations suggest an inability to detect effect sizes of interest.
- Solution:
- Increase Sample Size: Power for rare variants is profoundly dependent on sample size. Consider meta-analysis to combine summary statistics from multiple cohorts. Tools like REMETA and Meta-SAIGE are designed for scalable rare variant meta-analysis [48] [17].
- Re-evaluate Your Mask: The chosen variant mask might not optimally capture the causal variants. Try different functional annotations and frequency cut-offs. If you have a priori knowledge that effects are likely bidirectional, switch from a pure burden test to SKAT or SKAT-O [45] [44].
- Leverage Public Controls: For very rare diseases, sequencing large control cohorts may be infeasible. Using publicly available control databases like gnomAD is a viable strategy, but requires careful harmonization of variant calling and quality control to avoid artifacts. The TRAPD software provides a framework for this approach [41].
Problem: Inconsistent Results Across Sequencing Batches or Studies
- Symptoms: Association signals are not replicated. Variant counts differ significantly between batches for the same gene.
- Solution: This often stems from technical differences in sequencing platforms, variant calling pipelines, or data processing [41].
- Harmonize Processing: Jointly call variants across all cases and controls where possible. If using public controls, apply consistent quality control filters.
- Apply Depth-based Filtering: To mitigate coverage differences, calculate the proportion of individuals covered at a sufficient read depth (e.g., >10x) for each coding base and filter out low-coverage regions [41].
- Use Adaptive Quality Filtering: Implement a variant quality filtering approach that is calibrated using synonymous variants to lead to well-calibrated results, overcoming platform-specific artifacts [41].
Data Presentation: Key Methods for Rare Variant Analysis
The table below summarizes core statistical methods used in rare variant association analysis.
Table 1: Core Statistical Methods for Rare Variant Analysis
| Method | Type | Key Principle | Optimal Use Case | Common Software Implementations |
|---|---|---|---|---|
| CAST/Mb | Burden | Collapses variants in a region; tests burden score with a binary trait. | Early collapsing method for case-control design. | PLINK, REGENIE |
| Burden Test | Burden | Collapses variants into a single score; regresses phenotype on this score. | When most aggregated variants are causal and effects are unidirectional [44]. | REGENIE, SAIGE-GENE+, TRAPD [41] |
| SKAT [46] | Variance-Component | Models distribution of variant effects; a kernel machine regression test. | When many variants are non-causal or effects are bidirectional [45]. | SKAT, REGENIE, SAIGE-GENE+ |
| SKAT-O [45] | Hybrid | Optimally combines Burden and SKAT tests using a data-derived parameter. | Robust power when the true genetic architecture is unknown [45] [17]. | SKAT, REGENIE, SAIGE-GENE+, Meta-SAIGE [17] |
| ACAT-V [47] | P-value Combination | Combines p-values from single-variant tests using the Cauchy distribution. | Powerful when a small number of causal variants with strong effects are present [47]. | REGENIE, MetaSTAAR |
Experimental Protocol: Gene-Based Burden Testing with Public Controls
This protocol outlines the key steps for performing a gene-based burden test using case samples and publicly available control data, based on the methodology demonstrated in [41].
1. Variant Calling and Quality Control (QC)
- Sequencing & Alignment: Perform whole-exome sequencing on case samples. Align sequences to a reference genome (e.g., hg19/GRCh37) using tools like BWA [41].
- Joint Calling: Where possible, perform joint variant calling across all case samples to ensure consistency.
- Variant QC: Apply standard QC filters (e.g., using GATK Best Practices) including base quality score recalibration, indel realignment, and duplicate removal [41].
2. Variant Annotation and Filtering
- Functional Annotation: Annotate variants using a tool like Variant Effect Predictor (VEP) to determine their functional consequence (e.g., missense, synonymous, protein-truncating) [41].
- Frequency Annotation: Annotate variants with allele frequencies from public databases (e.g., gnomAD). Use the population maximum allele frequency for filtering.
- Define Qualifying Variants: Create a "mask" of rare, protein-altering variants for the burden test. This typically includes variants with a population MAF below a set threshold (e.g., <0.1%) that are protein-truncating or predicted to be deleterious.
3. Data Harmonization with Public Controls
- Control Data: Obtain variant-level data from a public resource like gnomAD.
- Address Artifacts: Systematically overcome sources of artifact from differences in sequencing platforms and data processing.
- Use synonymous variants as a calibration set to assess and correct for false positive signals.
- Apply an adaptive variant quality filtering method [41].
- Read Depth Adjustment: Annotate each coding exon and calculate the proportion of individuals covered at a sufficient depth (e.g., >10x). Filter out low-coverage regions to ensure variant calls are comparable between cases and public controls [41].
4. Burden Test Association Analysis
- Construct Burden Score: For each gene and individual (case and public control), create a burden score. This can be a binary indicator (presence/absence of any qualifying variant) or a weighted sum of variants.
- Perform Statistical Test: Use a software package like TRAPD (Test Rare vAriants with Public Data) to perform the association test, which fits a regression model of the phenotype on the burden score while adjusting for covariates like principal components to control for population stratification [41].
The Scientist's Toolkit: Research Reagent Solutions
Table 2: Essential Software Tools for Burden Testing and Rare Variant Analysis
| Tool Name | Function | Key Feature | Reference |
|---|---|---|---|
| TRAPD | Gene-based burden testing using public control databases. | Designed to overcome artifacts from using public data; user-friendly. | [41] |
| REGENIE/SBAT | Whole-genome regression for association testing; includes SBAT for joint burden testing. | Efficient for large datasets; tests multiple burden scores jointly under same-direction effects [47]. | [47] |
| SAIGE-GENE+ / Meta-SAIGE | Rare variant association tests for individual-level data and meta-analysis. | Controls type I error for binary traits with imbalance; scalable meta-analysis [17]. | [17] |
| REMETA | Meta-analysis of gene-based tests using summary statistics. | Uses a single sparse LD reference file per study, rescalable for any trait. | [48] |
| geneBurdenRD | R framework for gene burden testing in rare disease cohorts. | Open-source; tailored for Mendelian diseases and unbalanced studies. | [49] |
Workflow Visualization
The following diagram illustrates the logical workflow and decision process for selecting and applying core rare variant association methods.
Rare Variant Analysis Selection
FAQ: Core Concepts and Test Selection
What is the fundamental difference between a burden test and a variance-component test like SKAT?
Burden tests and variance-component tests are two primary classes of gene-based association tests for rare variants. Their core difference lies in their underlying assumptions about the genetic architecture of the trait:
| Feature | Burden Tests | Variance-Component Tests (e.g., SKAT) |
|---|---|---|
| Core Assumption | All (or most) aggregated variants influence the trait in the same direction and with similar effect sizes. [50] [28] | Variant effects can be in different directions (protective and deleterious) and have variable magnitudes. [50] [51] |
| Methodology | Collapses multiple rare variants in a region into a single burden score (e.g., a count of minor alleles), which is then tested for association. [37] | Models the regression coefficients of individual variants as random effects from a distribution with a mean of zero and a variance that is tested for being greater than zero. [50] |
| Best Use Case | Powerful when a substantial proportion of variants are causal with effects in the same direction. [28] | Robust and powerful when many variants are neutral or have mixed effect directions. [50] [28] |
When should I use SKAT-O instead of SKAT or a burden test?
You should use SKAT-O (Optimal SKAT) when you lack prior knowledge about the genetic architecture of your trait, as it is designed to be robust across various scenarios. [52] SKAT-O optimally combines the burden test and the SKAT test into a single framework. [53] [52] It introduces a parameter, ρ, that balances the two tests:
- When ρ=1, SKAT-O becomes a burden test.
- When ρ=0, SKAT-O becomes the original SKAT.
The value of ρ is data-adaptively selected to minimize the p-value, ensuring that the test performs nearly as well as the more powerful of the two tests in any given scenario. [52] This makes SKAT-O a versatile and often recommended choice for exploratory analysis.
For a gene with 20 rare variants, under what conditions will an aggregation test be more powerful than a single-variant test?
Aggregation tests are more powerful than single-variant tests only when a substantial proportion of the variants are causal. [28] The power is strongly dependent on the underlying genetic model.
For example, analytic calculations show that if you aggregate all rare protein-truncating variants (PTVs) and deleterious missense variants, aggregation tests become more powerful than single-variant tests for over 55% of genes under the following assumptions:
- PTVs have an 80% probability of being causal.
- Deleterious missense variants have a 50% probability of being causal.
- Other missense variants have a 1% probability of being causal.
- A sample size (n) of 100,000.
- A region heritability (h²) of 0.1%. [28]
If only a very small fraction of variants are causal, the "noise" from neutral variants can dilute the signal, making single-variant tests more powerful for detecting the one causal variant. [28]
FAQ: Implementation and Troubleshooting
How do I adjust for population stratification and relatedness in SKAT/SKAT-O?
To adjust for population stratification (ancestry differences) and sample relatedness, you must include relevant covariates in your null model.
- Population Stratification: Include principal components (PCs) derived from genotype data as covariates in the analysis. [50] [51]
- Sample Relatedness: Use specialized methods or software that can account for familial correlation or a genetic relatedness matrix (GRM). For example:
- The
SKAT_NULL_emmaXfunction in the R package can adjust for kinship. [53] - Tools like SAIGE-GENE and REGENIE are explicitly designed to handle related samples and are implemented in workflows like the Aggregate Variant Testing (AVT) pipeline. [54]
- Methods like MONSTER extend SKAT-O for related individuals using a mixed model that incorporates a kinship matrix. [52]
- The
I am getting inflated type I error rates for a binary trait with highly unbalanced case-control ratios. How can I fix this?
Standard score tests can experience inflated type I error rates in such situations. To address this, use methods that incorporate more accurate approximations of the null distribution.
- Use Robust Implementations: Employ software like SAIGE or Meta-SAIGE which use saddlepoint approximation (SPA) to calibrate p-values accurately, especially for rare variants in unbalanced studies. [17]
- Check Software Capabilities: Ensure your chosen tool explicitly states it handles case-control imbalance. For instance, SAIGE-GENE is noted for handling unbalanced cohort sizes. [54]
What are kernel functions in SKAT, and how do I choose one?
A kernel function is a mathematical tool that measures the genetic similarity between pairs of individuals in the study. [50] [51] The choice of kernel defines how variants are weighted and combined in the test.
- Linear Kernel: The default and most common choice. It measures a linear relationship between genetic variants. [51]
- Linear Weighted Kernel: Similar to the linear kernel but incorporates pre-specified weights for each variant. A common practice is to upweight rarer variants based on the belief that they may have larger effects. [50] [51]
- Other Kernels: Polynomial or Gaussian kernels are less common but can be used to capture more complex, non-linear relationships between variants and the phenotype. [51]
For most studies, starting with the linear weighted kernel is recommended, using a weight function based on variant minor allele frequency (MAF).
How do I perform meta-analysis of gene-based SKAT tests across multiple cohorts?
Meta-analysis for methods like SKAT that rely on covariance matrices requires careful handling of linkage disequilibrium (LD) information. Modern tools have streamlined this process:
- Per-Cohort Preparation: Each study generates single-variant summary statistics (score statistics) and a sparse LD matrix (covariance matrix of genotypes).
- Efficient Meta-Analysis: Use specialized software like REMETA or Meta-SAIGE.
- REMETA uses a single, sparse reference LD file per study, which is rescaled for each trait using summary statistics, greatly reducing storage and computation needs. [48]
- Meta-SAIGE also allows the reuse of a single sparse LD matrix across all phenotypes in phenome-wide analyses, boosting computational efficiency. [17]
Experimental Protocol: A Typical Workflow for Gene-Based Rare Variant Association with SKAT/SKAT-O
The following protocol outlines the key steps for conducting a gene-based association analysis using the SKAT family of tests, from quality control to interpretation.
1. Quality Control (QC) of Genotype Data
- Objective: To ensure the reliability of genetic data and phenotype assignments.
- Methods:
- Perform standard QC on sequencing or genotyping data: check for call rates, Hardy-Weinberg equilibrium, concordance, and sample contamination. [37] [55]
- Investigate and exclude samples with unusually high heterozygosity, which can indicate DNA contamination. [37]
- For phenotypes, perform diagnostic checks for binary traits, especially with highly unbalanced case-control ratios, and consider using SPA-adjusted tests if necessary. [17]
2. Variant Annotation and Mask Definition
- Objective: To define the set of variants (the "mask") within each gene that will be tested.
- Methods:
- Use bioinformatics tools (e.g., ANNOVAR, SnpEff) to annotate variants with functional consequences (e.g., synonymous, missense, protein-truncating). [37] [55]
- Define one or more masks based on functional annotation and allele frequency. A common mask includes only protein-truncating and deleterious missense variants with a MAF below a threshold (e.g., 1%). [28] [55]
3. Association Testing with SKAT/SKAT-O
- Objective: To test for association between the defined variant sets and the phenotype.
- Methods (using R package
SKAT):- Fit the null model, regressing the phenotype on all covariates (e.g., age, sex, principal components) without the genetic data. This is a crucial and computationally efficient step in SKAT. [50]
- Use the
SKATorSKAT_Ofunction, providing: - The output is a single p-value for the gene-based test.
4. Multiple Testing Correction
- Objective: To control the false positive rate when testing thousands of genes.
- Methods: Apply multiple testing corrections such as the Bonferroni correction (conservative) or control the False Discovery Rate (FDR) using the Benjamini-Hochberg procedure. [50] [51]
5. Interpretation and Follow-up
- Objective: To understand the biological and clinical implications of significant findings.
- Methods: Significant genes should be examined in the context of prior biological knowledge. For aggregation tests, it can be helpful to inspect the individual variants within the significant gene to understand the source of the signal.
Test Selection Logic
The following diagram illustrates the logical workflow for choosing the most appropriate rare variant association test based on your prior assumptions about the genetic architecture.
Research Reagent Solutions
The table below lists key software tools and resources essential for conducting rare variant association analyses.
| Tool / Resource | Function | Key Features / Use Case |
|---|---|---|
| SKAT R Package [53] | Primary analysis | Implements Burden, SKAT, and SKAT-O tests for both continuous and binary traits. Allows for covariate adjustment and basic kinship adjustment. |
| SAIGE-GENE [17] [54] | Scalable analysis | Handles large-scale biobank data, sample relatedness, and severe case-control imbalance accurately through saddlepoint approximation. |
| REGENIE [48] [54] | Scalable analysis | Performs whole-genome regression for Step 1 and association testing for Step 2. Efficient for analyzing multiple traits in large datasets. |
| REMETA [48] | Meta-analysis | Efficiently meta-analyzes gene-based tests from summary statistics, using a single reference LD matrix per study. |
| Meta-SAIGE [17] | Meta-analysis | Extends SAIGE for meta-analysis, controls type I error for binary traits, and reuses LD matrices across phenotypes. |
| Variant Annotators (e.g., ANNOVAR, VEP) | Functional annotation | Predicts the functional impact of genetic variants (e.g., missense, LoF) which is critical for defining variant masks. [37] [55] |
This guide provides technical support for researchers implementing rare variant association analyses. Within the broader context of selecting optimal tools for rare variant research, RVTESTS and SAIGE-GENE represent two powerful, widely-adopted options. This resource addresses common implementation challenges through detailed troubleshooting guides and FAQs, equipping scientists and drug development professionals with practical solutions for their genomic studies.
Tool Comparison: RVTESTS vs. SAIGE-GENE
Table 1: Key characteristics of RVTESTS and SAIGE-GENE
| Feature | RVTESTS | SAIGE-GENE |
|---|---|---|
| Primary Analysis Focus | Comprehensive rare variant association tests [56] [57] | Set-based rare variant tests (Burden, SKAT, SKAT-O) [58] [59] |
| Supported Data Types | Quantitative traits, Binary traits [56] [57] | Binary traits, Quantitative traits [59] |
| Sample Relatedness | Handles related and unrelated individuals [56] [57] | Accounts for sample relatedness using Generalized Mixed Models [58] [59] |
| Key Strengths | Broad set of rare variant tests; Efficient for large datasets [57] | Handles case-control imbalance; Accurate p-values for unbalanced studies [59] [60] |
| Genetic Model Support | Additive, dominant, recessive [56] | Not explicitly specified in sources |
| Input Format | VCF, BCF, BGEN, PLINK [56] | VCF, BCF, BGEN, PLINK, SAV [59] |
Workflow Implementation
RVTESTS Analysis Workflow
SAIGE-GENE Analysis Workflow
Technical Support: Troubleshooting Common Issues
RVTESTS Implementation Issues
Problem: VCF file formatting errors
- Symptoms: Analysis fails to start or produces empty results
- Solution: Ensure VCF files are properly sorted, compressed, and indexed [56]
- Implementation:
Problem: Related individuals analysis fails
- Symptoms: Kinship matrix calculation errors or incorrect results
- Solution: Use
vcf2kinshipto generate proper kinship matrices before association testing [56] - Implementation:
SAIGE-GENE Implementation Issues
Problem: Missing dosage errors in step 2
- Symptoms: Error message: "Assertion
lhs.cols() == rhs.rows() && 'invalid matrix product'' failed" when using--IsDropMissingDosages=TRUE` [61] - Solution: Use
--IsDropMissingDosages=FALSEor ensure dosage data is complete across all samples - Implementation:
Problem: Unused arguments error in step 2
- Symptoms: Error: "unused arguments (weightsIncludeinGroupFile = opt$weightsIncludeinGroupFile...)" [61]
- Solution: Check R script version compatibility and remove or update deprecated parameters
- Implementation:
Frequently Asked Questions (FAQs)
Q1: When should I prefer aggregation tests over single-variant tests for rare variants?
Aggregation tests are more powerful than single-variant tests when a substantial proportion of variants in your gene or region are causal and have effects in the same direction. Specifically, aggregation tests show superior power when >55% of protein-truncating variants and deleterious missense variants are causal, particularly in large sample sizes (n=100,000+) with region heritability of 0.1% [28].
Q2: How does SAIGE-GENE handle case-control imbalance?
SAIGE-GENE uses a generalized mixed model approach that provides accurate p-values even with highly unbalanced case-control ratios. It has been successfully tested with ratios as extreme as 1:1138 (358 cases vs. 407,399 controls) [60]. The method accounts for this imbalance during null model fitting and association testing.
Q3: What are the key considerations for selecting variants in rare-variant analysis?
The selection of variant masks significantly impacts power. Current best practices include:
- Focusing on protein-truncating variants and deleterious missense variants
- Using functional annotations to prioritize likely causal variants
- Considering MAF thresholds (typically <0.5-1%) appropriate for your sample size
- Accounting for effect direction heterogeneity when choosing between burden and SKAT tests [28]
Q4: What are the computational requirements for running these tools on large biobank datasets?
Both tools are optimized for large-scale analyses:
- RVTESTS can analyze 64,000 individuals with linear mixed models on a server with 64GB RAM [57]
- SAIGE-GENE has been used in datasets exceeding 400,000 individuals [60]
- For whole-genome data, consider chromosomal batch processing and high-memory instances (e.g., mem3ssd1v2_x32) [60]
Research Reagent Solutions
Table 2: Essential inputs and their specifications for rare variant analysis
| Reagent/Input | Format Specifications | Function in Analysis |
|---|---|---|
| Genotype Data | VCF, BCF, BGEN, or PLINK format; properly sorted and indexed [56] [60] | Primary genetic input for association testing |
| Phenotype File | Space/tab-delimited with header; case/control coded as 1/0 for binary traits [58] [60] | Defines trait of interest and case-control status |
| Covariate File | Includes age, sex, principal components, other confounders [58] | Controls for confounding variables in the model |
| Sample File | Lists samples to include in analysis with proper IDs [60] | Ensures sample matching between genotype and phenotype data |
| Gene/Region File | BED format for regions; refFlat format for genes [56] | Defines aggregation units for gene-based tests |
| Kinship Matrix | Empirical or pedigree-based kinship coefficients [56] | Accounts for relatedness among samples |
Methodological Considerations for Rare Variant Analysis
Addressing Winner's Curse in Effect Size Estimation
Both single-variant and aggregation tests suffer from winner's curse bias, where effect sizes are overestimated in initial discovery analyses. This bias is particularly complex in rare variant analysis due to:
- Competing biases: Upward bias from winner's curse and downward bias from effect heterogeneity [40]
- Directional effects: Bias magnitude depends on true effect sizes and directions [40]
- Test dependency: Linear tests (burden) and quadratic tests (SKAT) show different bias patterns [40]
Recommended mitigation strategies:
- Apply bootstrap resampling methods for bias correction
- Use likelihood-based approaches for more accurate effect size estimation
- Consider median-based estimation across bootstrap replicates rather than mean [40]
Optimizing Power Through Functional Annotation
Integration of functional annotations significantly improves rare variant analysis power:
- Variant prioritization: Focus on protein-truncating variants and deleterious missense variants
- Weight incorporation: Use functional prediction scores to upweight likely causal variants
- Mask optimization: Develop gene-specific masks based on functional constraints [28]
Researchers should select tools that support integration of functional annotations and allow flexible weighting schemes based on variant predicted functional impact.
Overcoming Critical Challenges in Rare Variant Studies
Mitigating Population Stratification in Rare Variant Analysis
Troubleshooting Guides
Guide 1: Addressing False Positives and Statistical Inflation
Problem: Genome-wide association tests for rare variants show inflated test statistics (λGC >> 1) or unexpected false positive associations.
Diagnosis: This indicates inadequate correction for population stratification, which is particularly challenging for rare variants due to their recent origin and geographic localization [62] [63].
| Solution Approach | Best For | Limitations | Key Performance Metrics |
|---|---|---|---|
| Principal Components (PCs) [62] | Large sample sizes (>500 cases), between-continent stratification | Struggles with fine-scale structure; can inflate type-I-error with small case numbers (≤50) and few controls (≤100) | λGC ≈ 1.04-1.06 in well-controlled studies [64] |
| Linear Mixed Models (LMMs) [62] [65] | Data sets with family structure or cryptic relatedness | Can inflate type-I-error with small case numbers and large controls (≥1000); computationally intensive | Can achieve λGC < 1.01 in large cohorts [65] |
| Local Permutation (LocPerm) [62] | All sample sizes, especially small case numbers (e.g., 50 cases) | May require custom implementation | Maintains correct type-I-error in all simulated scenarios [62] |
| Spectral Components (SPCs) [63] | Fine-scale, recent population structure; rare variants | Requires phased data and IBD estimation | Reduces genomic inflation from 7.6 to 1.2 in some analyses; captures >90% of fine-scale structure [63] |
Implementation Steps for SPCs (Novel Method):
- Phase genotype data using standard software (e.g., Eagle, Shapeit).
- Estimate Identity-by-Descent (IBD) segments using a tool like iLASH [63].
- Construct an IBD graph by aggregating total IBD sharing for each sample pair, representing individuals as nodes. Create edges between nodes if their total IBD sharing exceeds a threshold (e.g., 6 cM) [63].
- Generate an adjacency matrix from this graph.
- Calculate Spectral Components via spectral decomposition of the graph Laplacian matrix to derive continuous components that capture fine-scale structure [63].
- Include SPCs as covariates in association models to adjust for recent ancestry.
Guide 2: Handling Small Sample Sizes in Rare Disease Studies
Problem: Association studies for rare diseases have limited statistical power due to small numbers of available cases (e.g., n=50).
Diagnosis: Standard correction methods fail with small samples: PCs inflate type-I-errors with too few controls (≤100), while LMMs inflate errors with very large control sets (≥1000) [62].
Solutions:
- Use Robust Methods: Employ LocPerm or the novel SPC approach, which maintain appropriate type-I-error rates even with 50 cases [62] [63].
- Leverage External Controls: Power can be significantly increased by adding large external control panels, provided an appropriate stratification correction (like LocPerm or SPCs) is applied [62].
- Family-Based Designs: Consider family-based association tests (e.g., FBAT) that are inherently immune to population stratification by using within-family information [65] [66].
Frequently Asked Questions
Q1: Why is population stratification a greater challenge for rare variants compared to common variants? Rare variants are typically much younger than common variants and often show strong geographic localization, resulting in fine-scale, non-linear population patterns. Traditional methods like Principal Components Analysis (PCA) assume linear gradients of genetic variation and struggle to capture this recent, discrete structure [62] [63].
Q2: My rare variant GWAS has a genomic inflation factor (λGC) of 1.4. What should I do? A λGC of 1.4 indicates substantial confounding. First, verify standard PCA correction was applied. If inflation persists, this suggests residual fine-scale stratification. Consider switching to or supplementing with methods designed for rare variants, such as Linear Mixed Models (LMMs) for general relatedness, or the novel Spectral Components (SPCs) specifically for recent structure, which have been shown to dramatically reduce such inflation [65] [63].
Q3: Are family-based study designs immune to population stratification in rare variant analysis? Yes, tests using only within-family information (e.g., transmission disequilibrium tests) are immune to stratification. However, this comes at the cost of statistical power. Newer methods that incorporate between-family information to increase power must then carefully correct for stratification, similar to population-based studies [65].
Q4: How can I identify if my dataset has problematic fine-scale population structure? Perform a PCA and visualize the first few components. If you see discrete clustering rather than smooth gradients, this indicates fine-scale structure. You can also estimate Identity-by-Descent (IBD) sharing. The presence of extensive, recent IBD sharing (e.g., segments >6 cM) among subsets of your sample is a key indicator of recent population structure that may confound rare variant tests [63].
Experimental Protocols
Protocol 1: Evaluating Correction Methods Using Real Exome Data
Objective: Compare the performance of different stratification correction methods in a realistic rare variant association study setting [62].
Materials:
- Dataset: Real exome sequencing data from 4,887 unrelated samples (e.g., from 1000 Genomes and in-house cohorts) [62].
- Software: Software for PCA (e.g., EIGENSTRAT), LMM (e.g., EMMAX), and custom scripts for LocPerm and SPCs.
- Computing Resources: High-performance computing cluster.
Methodology:
- Create Population Samples:
- European Sample: Select individuals of European ancestry, subdivided into Northern, Middle, and Southern ancestry groups to model within-continent stratification [62].
- Worldwide Sample: Select individuals from European, South-Asian, Middle-Eastern, and North-African ancestries to model between-continent stratification [62].
- Simulate Case/Control Status: For each sample, simulate a binary phenotype with a 15% case and 85% control ratio under the null hypothesis (no causal variants) to assess type-I-error inflation [62].
- Apply Correction Methods: Run a burden test (e.g., CAST) on each simulated dataset, correcting for stratification using:
- Evaluate Performance: For each method and scenario, calculate the genomic inflation factor (λGC) and empirical type-I-error rate. The method that maintains λGC closest to 1 and a type-I-error rate at the significance level (e.g., α=0.05) is best controlled.
Protocol 2: Implementing the Spectral Components (SPC) Method
Objective: Apply the novel SPC method to account for recent, fine-scale population structure in a biobank-scale dataset [63].
Materials:
- Dataset: Phased genotype data from a large cohort (e.g., UK Biobank).
- Software: iLASH for IBD estimation, and computational environments for graph construction (e.g., Python, R).
Methodology:
- Data Phasing: Use a phasing tool (e.g., Eagle, Shapeit) on the genotype data.
- IBD Estimation: Run iLASH on the phased data to detect genomic segments shared identical-by-descent between all pairs of individuals [63].
- IBD Graph Construction:
- Aggregate the total sum of IBD sharing (in cM) for each sample pair.
- Create an undirected graph where nodes represent individuals.
- Draw an edge between two nodes if their total IBD sharing exceeds a threshold of 6 cM [63].
- Spectral Decomposition:
- Generate the adjacency matrix (A) from the IBD graph, where Aᵢⱼ=1 if an edge exists between i and j, and 0 otherwise.
- Compute the graph Laplacian matrix (L = D - A), where D is the diagonal degree matrix.
- Perform eigenvalue decomposition on the Laplacian matrix L.
- The top eigenvectors (corresponding to the smallest non-zero eigenvalues) are the Spectral Components (SPCs) [63].
- Association Testing: Include the top SPCs as covariates in a rare variant association model (e.g., SKAT, burden test) to control for fine-scale population structure.
Workflow Visualization
Diagram 1: SPC Analysis Workflow.
The Scientist's Toolkit
| Research Reagent / Solution | Function in Experiment |
|---|---|
| Real Exome Datasets (e.g., 1000 Genomes, HGID) [62] | Provides realistic genetic data with natural allele frequency spectra and LD structure for method evaluation. |
| iLASH Software [63] | Detects segments of the genome shared Identical-By-Descent (IBD) between individuals, the foundation for SPC analysis. |
| Graph Laplacian Transformation [63] | A mathematical operation applied to the IBD graph to extract continuous components (SPCs) representing fine-scale genetic similarity. |
| Structured Association Software (e.g., STRUCTURE, ADMIXTURE) [65] [66] | Infers genetic ancestry for each individual, allowing for stratification by subpopulation clusters in association testing. |
| Linear Mixed Model Software (e.g., EMMAX, TASSEL) [65] | Models genetic relatedness between samples as a random effect to account for both population structure and cryptic relatedness. |
| Family-Based Association Test Software (e.g., FBAT, QTDT) [65] | Provides a framework for association testing that is inherently robust to population stratification by using within-family information. |
Diagram 2: Problem-Solution Guide.
Boosting Statistical Power through Variant Filtering and Annotation Weights
Frequently Asked Questions
1. What is the primary benefit of using functional annotations in rare variant analysis? Incorporating functional annotations allows you to prioritize potentially causal variants and filter out non-functional ones. This increases the signal-to-noise ratio in your analysis, which significantly boosts statistical power to detect genuine associations by focusing the test on variants most likely to have a biological impact [67] [68].
2. My dataset is large; which method scales well for biobank-level data? For large-scale studies, MultiSTAAR is designed to be computationally scalable for whole-genome sequencing data while accounting for relatedness and population structure [69]. Alternatively, DeepRVAT uses a deep learning framework that also scales efficiently, with training time increasing linearly with the number of individuals [70].
3. How can I handle a situation where high-quality functional annotations are not available? When good functional annotations are unavailable, variable selection methods like Lasso, Elastic Net, or SCAD can be used to create a "statistical annotation" by learning variant weights directly from the data. While computationally more intensive, this approach can outperform fixed weighting schemes in the absence of prior functional information [71].
4. How do I analyze non-coding rare variants, which are harder to interpret than coding variants? For non-coding variants, leverage cell-type-specific functional annotations. Methods like gruyere use predicted enhancer and promoter regions, along with variant effect predictions (e.g., for transcription factor binding or chromatin state) from tools like Enformer or SpliceAI, to define meaningful test sets for non-coding regions and pinpoint their likely target genes [68] [72].
5. What should I do if my rare variant association test lacks calibration? The DeepRVAT framework is specifically noted for providing calibrated tests, which is particularly important for avoiding false positives when analyzing imbalanced binary traits [70]. Ensuring proper calibration of the underlying null model is also critical.
Comparison of Selected Rare Variant Analysis Methods
The table below summarizes several advanced methods that integrate variant annotations to boost power.
| Method Name | Core Approach | Key Features for Annotation Use | Reported Power Gain |
|---|---|---|---|
| GAMBIT [67] | Omnibus testing framework | Integrates heterogeneous annotation classes (coding, eQTL, enhancer) into a unified gene-based test. | Increases power and performance in identifying causal genes. |
| MultiSTAAR [69] | Multi-trait rare variant analysis | Dynamically incorporates multiple functional annotations within a scalable pipeline for joint analysis of multiple correlated traits. | Discovers new associations missed by single-trait analysis. |
| gruyere [68] [72] | Empirical Bayesian framework | Learns trait-specific weights for functional annotations on a genome-wide scale to improve variant prioritization. | Identifies significant genetic associations not detected by other methods. |
| DeepRVAT [70] | Deep set neural network | Learns a trait-agnostic gene impairment score from dozens of variant annotations in a data-driven manner, capturing non-linear effects. | 75% increase in gene discoveries vs. baseline (Burden+SKAT); improved replication rates. |
| Variable Selection (Lasso, EN, SCAD) [71] | Penalized regression | Creates "statistical annotations" by performing variable selection on variants within a region, useful when functional annotations are poor. | Outperforms other methods in the absence of good annotation. |
Experimental Workflow: Selecting an Annotation Strategy
The following diagram outlines a logical workflow for choosing a variant filtering and weighting strategy, based on common experimental scenarios.
| Resource Category | Specific Tool / Database | Primary Function in Analysis |
|---|---|---|
| Variant Effect Predictors | CADD, SpliceAI, AlphaMissense, PrimateAI, Enformer | Provides in silico predictions of a variant's deleteriousness or functional impact on splicing, protein function, or regulation. [68] [70] |
| Functional Annotations | ENCODE, Roadmap Epigenomics, Genotype-Tissue Expression (GTEx) Project | Provides experimental data on regulatory elements, chromatin states, and expression quantitative trait loci (eQTLs) for tissue and cell-type-specific annotation. [67] [70] |
| Regulatory Element Mapping | Activity-by-Contact (ABC) Model, JEME, GeneHancer | Predicts physical connections between enhancers and their target genes, crucial for defining non-coding variant test sets. [67] [68] |
| Analysis Pipelines & Software | GAMBIT, MultiSTAAR, DeepRVAT, gruyere | Integrated frameworks that implement specific statistical methods for annotation-informed rare variant association testing. [67] [69] [68] |
| Reference Data | 1000 Genomes Project (1KGP), gnomAD | Provides population allele frequency data essential for defining rare variants and for Linkage Disequilibrium (LD) reference panels. [67] [69] |
Addressing Small Sample Sizes and Extreme Case-Control Imbalance
Troubleshooting Guides
Q1: Why does my rare variant association test have inflated Type I error, and how can I fix it?
Problem: A primary cause of Type I error inflation in unbalanced studies is the violation of asymptotic assumptions in standard statistical tests when case numbers are very small relative to controls [73]. This is particularly problematic for rare variants where minor allele counts are already low.
Solutions:
- Use Saddlepoint Approximation (SPA): Methods like SAIGE and SAIGE-GENE+ employ SPA, which uses all moments of the distribution rather than just the first two (like the normal distribution), providing more accurate p-value calibration for unbalanced data [73] [17].
- Apply Firth's Logistic Regression: This penalized likelihood approach reduces small-sample bias and helps resolve separation issues where some genotype categories have few or no observed events [74].
- Implement Two-Level SPA: For meta-analyses, Meta-SAIGE uses SPA on score statistics from each cohort plus a genotype-count-based SPA for combined statistics, effectively controlling Type I error even for low-prevalence traits [17].
- Filter by Minor Allele Count (MAC): Applying a MAC filter (e.g., MAC ≥ 5 or 10) can eliminate the most problematic variants and reduce inflation [17] [74].
Q2: Which association test should I choose for my unbalanced case-control study?
Problem: Standard burden tests and dispersion tests perform differently under various imbalance and genetic architecture scenarios. Selecting the wrong test can substantially reduce power.
Solutions:
- For Direction-Homogeneous Effects: Use burden tests (e.g., CAST, weighted burden tests) when you expect most rare variants in your gene to affect the trait in the same direction [36] [75].
- For Direction-Heterogeneous Effects: Choose variance-component tests like SKAT or SKAT-O when variants likely have different effect directions or when including non-causal variants [76] [75].
- For Maximum Power: SAIGE-GENE+ and Meta-SAIGE implement multiple tests (Burden, SKAT, SKAT-O) and combine them, often providing robust power across different scenarios [17].
- Consider Sample Size: With unbalanced designs, SKAT generally outperforms burden tests when case numbers are limited (e.g., <500 cases) [76].
Q3: How can I improve power for rare variant detection with limited cases?
Problem: Standard approaches may fail to detect genuine rare variant associations when case numbers are small, leading to false negatives.
Solutions:
- Aggregate Variants Intelligently: Use biologically informed variant aggregation (e.g., by gene, functional domain, or pathway) rather than single-variant tests [36] [75].
- Incorporate Functional Annotations: Prioritize likely functional variants (nonsynonymous, loss-of-function) in your testing set to reduce noise from neutral variants [36] [55].
- Utilize Meta-Analysis: Combine summary statistics across multiple cohorts using methods like Meta-SAIGE, which can detect associations not significant in individual studies [17].
- Optimize Case-Control Ratio: While counterintuitive, extremely unbalanced designs sometimes provide better power than balanced designs for highly penetrant risk alleles, particularly when the risk allele is rare [77].
Frequently Asked Questions (FAQs)
Q: What is the minimum number of cases needed for meaningful rare variant analysis?
A: While there's no universal minimum, empirical evidence suggests:
- SKAT can achieve >90% power with ~200 cases in highly unbalanced designs (e.g., 200 cases vs. 10,000 controls) for variants with moderate effects [76].
- Burden tests typically require ≥500 cases to achieve similar power under the same conditions [76].
- For very rare variants (MAF < 0.1%), even larger case samples may be necessary regardless of the number of controls.
Q: How does case-control imbalance specifically affect different association tests?
A: The effects vary by test type:
- Standard Logistic Regression: Substantial Type I error inflation, especially when expected cell counts <5 [74].
- Burden Tests: Moderate inflation, but generally better controlled than linear mixed models [76].
- SKAT/SKAT-O: Higher Type I error in unbalanced designs, though less than burden tests in some scenarios [76].
- SAIGE/Meta-SAIGE: Well-controlled Type I error through SPA adjustment [73] [17].
Q: Can I use linear mixed models (LMM) for binary traits with extreme imbalance?
A: This is not recommended. LMMs treating binary traits as continuous produce uninterpretable effect estimates and often have inflated Type I error rates for unbalanced case-control ratios [73] [74]. Generalized linear mixed models (GLMMs) or specialized methods like SAIGE are more appropriate.
Table 1: Empirical Type I Error Rates at α = 2.5×10⁻⁶ for Different Methods (1% Prevalence)
| Method | Adjustment | Type I Error Rate | Inflation Factor |
|---|---|---|---|
| No adjustment | None | 2.12×10⁻⁴ | ~100× |
| SPA adjustment | Single-level SPA | 5.23×10⁻⁶ | ~2× |
| Meta-SAIGE | Two-level SPA | 2.71×10⁻⁶ | ~1.1× |
| SAIGE-GENE+ | SPA + ER | 2.89×10⁻⁶ | ~1.2× |
Data based on simulations with 160,000 samples, three cohorts, disease prevalence 1% [17].
Table 2: Power Comparison for Detecting Rare Variant Associations (80% Power Threshold)
| Method | Cases Required | Controls Required | Notes |
|---|---|---|---|
| SKAT | ~200 | 10,000 | Unbalanced design |
| Burden Test | ~500-1,000 | 10,000 | Unbalanced design |
| SAIGE | Comparable to joint analysis | - | Nearly identical to individual-level data |
| Weighted Fisher's Method | ~40% more cases | - | Substantially less powerful than Meta-SAIGE |
Data synthesized from multiple simulation studies [17] [76].
Experimental Protocols
Protocol 1: SAIGE Analysis Workflow for Unbalanced Studies
Purpose: To conduct rare variant association testing while controlling for case-control imbalance and sample relatedness.
Steps:
- Null Model Fitting: Fit the null logistic mixed model to estimate variance components and other parameters using the average information restricted maximum likelihood (AI-REML) algorithm [73].
- Parameter Estimation: Utilize the preconditioned conjugate gradient (PCG) method to solve linear systems without inverting the genetic relationship matrix (GRM) [73].
- Variance Ratio Calculation: Calculate the ratio of variances of score statistics with and without variance components using a subset of randomly selected genetic variants [73].
- Association Testing: For each variant, use the variance ratio to calibrate the score statistic variance, then apply saddlepoint approximation to obtain accurate p-values [73].
- Gene-Based Tests: Perform Burden, SKAT, and SKAT-O tests using various functional annotations and MAF cutoffs [17].
Computational Requirements: ~10GB memory for 400,000 samples; computation time scales as O(MN) for M variants and N samples [73].
Protocol 2: Meta-Analysis of Rare Variant Studies with Meta-SAIGE
Purpose: To combine rare variant association results across multiple cohorts while controlling for imbalance.
Steps:
- Summary Statistics Preparation: Generate per-variant score statistics (S) and sparse LD matrices (Ω) for each cohort using SAIGE [17].
- Data Consolidation: Combine score statistics from all studies into a single superset [17].
- Variance Recalculation: For binary traits, recalculate the variance of each score statistic by inverting the SAIGE-generated p-value [17].
- Covariance Matrix Calculation: Compute Cov(S) = V¹ᐟ²Cor(G)V¹ᐟ², where Cor(G) uses the sparse LD matrix and V contains GC-SPA-adjusted variances [17].
- Gene-Based Testing: Conduct rare variant tests identically to SAIGE-GENE+, including ultra-rare variant collapsing [17].
Advantage: LD matrices are not phenotype-specific and can be reused across different phenotypes, significantly reducing computational burden [17].
Workflow Diagrams
Research Reagent Solutions
Table 3: Essential Software Tools for Rare Variant Analysis with Imbalanced Data
| Tool Name | Primary Function | Key Features for Imbalanced Data | Reference |
|---|---|---|---|
| SAIGE | Generalized mixed model association testing | Saddlepoint approximation for case-control imbalance; O(MN) computation | [73] |
| Meta-SAIGE | Rare variant meta-analysis | Two-level SPA (cohort + genotype-count); reusable LD matrices | [17] |
| SKAT | Variance-component gene-based tests | Robust to effect direction heterogeneity; works well with ~200 cases | [76] |
| Firth Logistic Regression | Bias-reduced association testing | Penalized likelihood solves separation issues; valid for small samples | [74] |
| STAAR | Functional-informed rare variant test | Integrates multiple functional annotations; various MAF cutoffs | [17] |
Table 4: Key Database Resources for Variant Annotation and Interpretation
| Resource | Primary Use | Application to Rare Variants | Reference |
|---|---|---|---|
| gnomAD | Population allele frequencies | Filtering common variants; assessing variant rarity | [6] |
| ClinVar | Clinical significance | Interpreting pathogenic/benign status | [6] |
| OMIM | Gene-phenotype relationships | Prioritizing genes for collapsing | [55] |
| CADD | Variant deleteriousness | Weighting variants in burden tests | [75] |
Optimizing Genotype Imputation Accuracy for Rare Variants
Troubleshooting Guides
Guide 1: Addressing Poor Imputation Accuracy for Rare Variants
Problem: Imputed rare variants (MAF < 0.01) show low quality scores (e.g., r² < 0.7) or fail association tests despite high certainty scores from imputation software.
Solutions:
- Increase Reference Panel Size and Diversity: Use the largest available reference panel (e.g., TOPMed) that includes haplotypes from populations genetically similar to your study cohort. For variants with minor allele count (MAC) below 10, even large reference panels may yield r² < 0.5 [78].
- Leverage Family Data: For studies involving related individuals, implement a two-stage imputation approach: first use a population-based method (e.g., IMPUTE2), then refine with a family-based method (e.g., Merlin) using genotypes with posterior probability > 0.9 [79].
- Validate with Ground Truth: Where possible, use a subset of sequenced samples to verify imputation accuracy. Be aware that imputation quality metrics like Rsq may overestimate accuracy for non-European populations [80].
- Adjust Analysis for Imputation Uncertainty: For association testing, use genotype dosages instead of hard calls and incorporate imputation quality metrics as weights in statistical models [81] [82].
Guide 2: Managing Population-Specific Biases in Imputation
Problem: Imputation accuracy varies significantly across ancestral groups, with lower performance for underrepresented populations.
Solutions:
- Use Ancestry-Matched Reference Panels: Supplement large reference panels (e.g., TOPMed) with population-specific sequences when available. Meta-imputation approaches may help but require validation [80].
- Evaluate Disparities Systematically: Calculate and compare mean imputation r² across MAF spectra separately for each ancestral group in your study. For example, Saudi Arabians, Vietnamese, and Thai populations show mean r² of 0.79, 0.78, and 0.76 respectively for MAF 1-5%, compared to 0.90-0.93 in European populations [80].
- Consider Direct Genotyping: For clinically actionable rare variants, complement imputation with direct genotyping to ensure accuracy [81].
- Account for Haplotype Diversity: Be aware that haplotypes carrying risk alleles may be more common in cases than reference panels, potentially introducing systematic errors [83].
Frequently Asked Questions (FAQs)
Q1: What minimum reference panel size is needed for accurate rare variant imputation? There is no universal minimum, as accuracy depends on allele count rather than overall panel size. For a rare variant (MAF ~0.1%), achieving r² > 0.9 requires sufficient haplotypes carrying the minor allele in the reference. Theoretical models show error rates remain substantial until minor allele count reaches approximately 10-20 copies in the reference panel [78].
Q2: Which imputation software performs best for rare variants? Performance varies by context. GLIMPSE shows effectiveness for rare variants in admixed populations, while Beagle offers speed for large datasets. For family data, a combination of SHAPEIT for prephasing followed by IMPUTE2 or GLIMPSE may be optimal [84] [81] [79]. The table below compares software characteristics:
Table 1: Imputation Software for Rare Variants
| Software | Strengths | Weaknesses | Optimal Context |
|---|---|---|---|
| GLIMPSE | Effective for rare variants in admixed populations | Computationally intensive | Admixed cohorts; rare variant focus [81] |
| Beagle | Fast, integrates phasing and imputation | Less accurate for rare variants | Large datasets, high-throughput studies [81] |
| IMPUTE2 | High accuracy for common variants; extensively validated | Computationally intensive | Smaller datasets, family studies [81] [79] |
| Minimac4 | Scalable, optimized for low memory usage | Slight accuracy trade-off | Very large datasets, meta-analyses [81] |
Q3: How does sequencing coverage in the target dataset affect rare variant imputation? Low-coverage whole genome sequencing (lcWGS) at 0.5x coverage can be cost-effective, reaching ~90% accuracy after optimization with appropriate tools. However, the optimal coverage depends on study goals and should be determined empirically [84].
Q4: Why might a truly associated rare variant show no association after imputation? This may occur from "missing and discordant imputation errors," which disproportionately affect risk alleles. When haplotypes carrying risk alleles are more common in cases than the reference panel, imputation may produce monomorphic calls or false-negative associations [83].
Q5: Can imputation accurately identify very rare variants (MAF < 0.001)? Yes, but with limitations. TOPMed imputation can handle variants with MAF as low as 5×10⁻⁵, though accuracy decreases substantially for singletons and doubletons. For MAF < 0.001, even with TOPMed reference, r² may be below 0.5, requiring careful interpretation [82] [78].
Data Presentation
Table 2: Factors Affecting Rare Variant Imputation Accuracy and Optimization Strategies
| Factor | Impact on Accuracy | Optimization Strategy | Evidence |
|---|---|---|---|
| Reference Panel Size | Minor allele count (MAC) >10 needed for r²>0.7; Theoretical limit exists even with large n | Use largest diverse panels (TOPMed); Aim for MAC>10 for target variants | [78] |
| Population Match | Mean r² 0.62-0.79 for non-Europeans vs 0.90-0.93 for Europeans at MAF 1-5% | Add population-specific sequences; Consider direct genotyping for key variants | [80] |
| Variant Frequency | r² decreases dramatically below MAF 0.001; MAC 2-10 shows fastest accuracy drop | Focus on variants with MAC>10; Use specialized tools (GLIMPSE) | [82] [78] |
| Study Design | Family data improves accuracy for MAF 0.01-0.40 | Two-stage imputation (population + family-based) | [79] |
| Input Data Quality | 0.5x WGS can achieve ~90% accuracy with optimization | Optimize parameters (e.g., effective population size) | [84] |
Experimental Protocols
Protocol 1: Two-Stage Imputation for Family Data
Purpose: Improve imputation accuracy for rare variants (MAF 0.01-0.40) in studies with related individuals [79].
Procedure:
- Quality Control: Remove SNPs with >5% missing data and individuals with >5% missing data.
- Prephasing: Phase all data using SHAPEIT2 with the duoHMM algorithm that incorporates pedigree information to improve phasing and eliminate Mendelian errors.
- First-Stage Imputation: Perform population-based imputation using IMPUTE2 with combined reference panel (local sequences + cosmopolitan reference).
- Variant Selection: Filter imputed genotypes to retain those with posterior probability > 0.9 and MAF above chosen cutoff (0.01 recommended).
- Second-Stage Imputation: Use selected genotypes as additional input for family-based imputation with Merlin, accounting for relatedness.
Validation: Use leave-one-out cross-validation by masking sequence data of individuals and comparing imputed versus true genotypes.
Protocol 2: Optimizing Low-Coverage WGS for Imputation
Purpose: Achieve cost-effective rare variant imputation from low-coverage whole genome sequencing [84].
Procedure:
- Reference Panel Construction: Generate high-quality haplotype panel from 168 individuals sequenced at ~18.63x coverage, identifying 10.3 million high-quality biallelic SNPs.
- Prephasing and Imputation: Use SHAPEIT for prephasing followed by GLIMPSE1 for imputation.
- Parameter Optimization: Systematically optimize key parameters, particularly the effective population size (ne).
- Coverage Testing: Evaluate different coverage levels (0.5x, 1x) to determine cost-effectiveness.
- Accuracy Assessment: Measure accuracy using median Pearson correlation coefficient between imputed and true genotypes.
Expected Outcome: ~90% median accuracy at 0.5x coverage after optimization.
Workflow Diagram
Optimization Workflow for Rare Variant Imputation
The Scientist's Toolkit
Table 3: Essential Research Reagents and Computational Tools
| Resource | Type | Primary Function | Application Notes |
|---|---|---|---|
| TOPMed Reference Panel | Reference Panel | Provides diverse haplotypes for imputation | Enables imputation of variants with MAF as low as 5×10⁻⁵; improves non-European imputation [82] [80] |
| SHAPEIT2/SHAPEIT | Phasing Tool | Computational prephasing of genotypes | Incorporates pedigree information via duoHMM; critical for family data [84] [79] |
| GLIMPSE1 | Imputation Software | Rare variant imputation in admixed populations | Optimal for low-coverage WGS; effective for rare variants [84] [81] |
| IMPUTE2 | Imputation Software | Population-based imputation | High accuracy for common variants; suitable for family study first stage [81] [79] |
| Merlin | Imputation Software | Family-based imputation | Leverages pedigree information; used in second-stage imputation [79] |
| Beagle | Imputation Software | Integrated phasing and imputation | Fast processing; suitable for large datasets [81] [85] |
Integrating Functional Predictions to Prioritize Causal Variants
Frequently Asked Questions (FAQs)
What are the primary strategies for prioritizing causal variants in rare disease research?
Two main strategies exist for prioritizing causal variants. The first uses tools like Exomiser and LIRICAL, which combine variant pathogenicity predictions with phenotypic data (HPO terms) to rank candidates [86]. The second employs more advanced, disease-context-aware models like MAVERICK, an ensemble of neural networks specifically trained to classify variants as benign, dominant pathogenic, or recessive pathogenic, significantly improving diagnostic yield [87].
Why does my variant prioritization workflow run into memory errors, and how can I resolve this?
Workflows can encounter memory errors when processing genes with an unusually high number of variants or particularly long genes [32]. To resolve this, you can increase the memory allocation for specific tasks in your workflow files (e.g., annotation.wdl and quick_merge.wdl). The table below provides specific parameter adjustments for common tasks [32].
Table: Recommended Memory Adjustments for Workflow Tasks
| Workflow File | Task | Parameter | Default Value | Adjusted Value |
|---|---|---|---|---|
quick_merge.wdl |
split |
memory | 1 GB | 2 GB |
first_round_merge |
memory | 20 GB | 32 GB | |
second_round_merge |
memory | 10 GB | 48 GB | |
annotation.wdl |
fill_tags_query |
memory | 2 GB | 5 GB |
annotate |
memory | 1 GB | 5 GB | |
sum_and_annotate |
memory | 5 GB | 10 GB |
How can I improve the interpretability of my variant prioritization results?
To improve interpretability, use tools that provide explanations for their rankings. The 3ASC algorithm, for example, annotates variants using the 28 ACMG/AMP guideline criteria and employs explainable AI (X-AI) techniques like Shapley Additive Explanations (SHAP) to show how each feature contributed to a variant's priority score [86]. This moves beyond a "black box" score to provide clinical geneticists with auditable evidence for each variant.
What does it mean if I find autosomal hemizygosity (ACHemivariant > 0) in my results?
For autosomal variants, a haploid (hemizygous-like) call indicates that a variant is located within a known deletion on the other chromosome for that sample [32]. These calls are not artifacts of aggregation but originate from the single-sample gVCFs. For example, a heterozygous deletion call upstream of a Single Nucleotide Polymorphism (SNP) can lead to the SNP being represented as a haploid ALT call on the non-deleted chromosome [32].
Troubleshooting Guides
Issue: Low Recall in Top Variant Rankings
Problem: The true causal variant is not ranked within the top candidates by your prioritization tool.
Solution:
- Use More Sensitive Tools: Consider switching to or incorporating modern tools with demonstrated higher sensitivity. For instance, the 3ASC algorithm has shown a top 1 recall of 85.6% and a top 3 recall of 94.4% in tests, outperforming other methods [86].
- Leverage Mendelian-Specific Predictors: For monogenic diseases, use tools like MAVERICK. In a cohort of 644 solved patients, MAVERICK ranked the causative pathogenic variant within the top five in over 95% of cases, with the top-ranked variant solving 76% of cases [87].
- Incorporate Multiple Evidence Types: Ensure your pipeline integrates diverse data. 3ASC, for example, combines ACMG/AMP criteria-based Bayesian scores, phenotype similarity scores, functional impact scores from a deep-learning model (3Cnet), and features to reduce false positives [86].
Issue: Handling Novel Disease Genes
Problem: Standard pathogenicity predictors perform poorly when the causal variant is in a gene not previously associated with disease.
Solution:
- Employ Models Trained for Novelty: Use tools specifically evaluated on "novel genes." MAVERICK, for example, ranks the causative pathogenic variant within the top five candidate variants in 70% of such cases, facilitating novel gene discovery [87].
- Focus on Functional Evidence: When gene-level evidence is absent, prioritize functional predictions from deep-learning models that analyze the protein sequence context, which can be more generalizable.
Issue: Different Tools Give Conflicting Priorities
Problem: Various prioritization tools rank the same set of variants differently, creating confusion.
Solution:
- Understand Tool Methodologies: Know what each tool is optimized for. The table below compares several key tools.
- Inspect Explanatory Evidence: Use tools that provide reasoning. 3ASC provides annotated ACMG/AMP evidence, allowing you to manually review the strength behind each classification [86].
- Define a Consensus Strategy: Establish a lab-specific protocol for handling discordant results, such as requiring a variant to be highly ranked by multiple tools or requiring strong evidence from an explainable tool.
Table: Comparison of Variant Prioritization Tools and Methods
| Tool/Method | Core Methodology | Key Strength | Best For |
|---|---|---|---|
| 3ASC [86] | Random Forest integrating ACMG criteria, phenotype, & functional scores. | High sensitivity & explainability via annotated evidence. | Clinical diagnostics where interpretability is critical. |
| MAVERICK [87] | Ensemble of transformer-based neural networks. | High accuracy for Mendelian traits; classifies inheritance. | Prioritizing protein-altering variants in monogenic diseases. |
| Exomiser [86] [87] | Logistic regression combining variant & gene-based (phenotype) scores. | Established; effective integration of HPO terms. | General purpose variant prioritization with phenotype data. |
| LIRICAL [86] | Statistical framework calculating posterior probability of diagnoses. | Computes a likelihood ratio for each candidate disease. | Rapid differential diagnosis. |
Experimental Protocols
Protocol: Identifying Functional Variants in a Longevity Cohort
This protocol is based on a 2025 study that identified rare functional variants in the IGF-1 gene associated with exceptional longevity [88].
1. Cohort Selection and Data Preparation:
- Cohort: Assemble a cohort of individuals with the trait of interest (e.g., ≥95 years for longevity) and appropriate controls. The referenced study used over 2,000 Ashkenazi Jewish individuals [88].
- Sequencing: Perform Whole-Exome Sequencing (WES). Ensure high sequence quality by excluding samples with low coverage.
- Variant Filtering: Focus on rare variants with a Minor Allele Frequency (MAF) of less than 1%, which are often missed in standard GWAS [88].
2. Variant Annotation and Functional Prediction:
- Annotation: Use tools like CADD to predict the functional impact of variants. Set a CADD score threshold (e.g., ≥20) to define "functional" variants [88].
- Prioritization: Filter and prioritize variants based on their rarity and predicted functional impact.
3. Molecular Validation (In Silico):
- Protein Modeling: For prioritized missense variants, obtain the 3D structure of the protein (e.g., from the Protein Data Bank).
- Molecular Dynamics (MD) Simulations: Perform MD simulations to compare the mutant and wild-type proteins.
- Analysis:
- Binding Affinity: Use methods like MM-GBSA to calculate and compare the binding energy of the mutant and wild-type. A less stable binding (higher energy) suggests diminished function [88].
- Serum Levels: For other variants, measure circulating serum levels of the protein (e.g., via ELISA) to identify variants that may affect stability or production [88].
Workflow Diagram: Variant Prioritization and Validation
The Scientist's Toolkit: Research Reagent Solutions
Table: Essential Computational Tools for Variant Prioritization
| Tool / Resource | Function | Application Note |
|---|---|---|
| MAVERICK | A neural network-based tool to classify variants as Benign, Dominant Pathogenic, or Recessive Pathogenic [87]. | Ideal for first-pass prioritization in monogenic diseases due to its high top-5 recall rate. |
| 3ASC | An explainable AI system that prioritizes variants by annotating ACMG/AMP criteria and calculating a Bayesian score [86]. | Use when clinical interpretation and evidence transparency are required. |
| Exomiser | A well-established tool that combines variant pathogenicity predictions with phenotype matching via HPO terms [86] [87]. | A robust standard for integrating phenotypic data into the prioritization pipeline. |
| Molecular Dynamics (MD) Software (e.g., Schrödinger) | Software suites for performing in silico protein modeling and MD simulations [88]. | Critical for functionally validating the mechanistic impact of prioritized missense variants on protein structure and binding. |
| Protein Data Bank (PDB) | A database for 3D structural data of proteins and other biological macromolecules [88]. | The source of initial protein structures required for setting up MD simulations. |
| VarSome | A comprehensive platform for the annotation and interpretation of genetic variants [89]. | Useful for clinical classification and gathering evidence from multiple databases. |
Tool Integration Diagram
Ensuring Robustness and Translating Findings to the Clinic
Frequently Asked Questions (FAQs)
General Concepts
Q1: What is the main advantage of using meta-analysis for rare variant studies in biobanks? Meta-analysis significantly enhances statistical power for identifying genetic associations by combining summary statistics from multiple cohorts. This is particularly crucial for rare variants, which occur at low frequencies and are often underpowered in single-cohort studies. For example, a recent meta-analysis of 83 low-prevalence phenotypes across two biobanks identified 237 gene-trait associations, 80 of which were not significant in either dataset alone, highlighting the power of this approach [17].
Q2: What are the common statistical tests used in rare variant association analysis? The primary gene-based tests for rare variants include:
- Burden Test: Aggregates multiple rare variants within a gene into a single score, assuming all variants have similar effects on the trait [36].
- SKAT (Sequence Kernel Association Test): Tests for associations by modeling variant effects flexibly, without assuming all variants have the same effect direction or magnitude [17].
- SKAT-O: An optimized combination of the Burden test and SKAT that adaptively weights the contributions of both methods to maximize power [17].
Methodology and Implementation
Q3: My meta-analysis of a binary trait with low prevalence shows inflated type I error. What could be the cause and solution? Type I error inflation is a known challenge in meta-analysis of low-prevalence binary traits. Standard methods can be highly inflated. The Meta-SAIGE method addresses this by employing a two-level saddlepoint approximation (SPA) to accurately estimate the null distribution. This includes applying SPA to score statistics from each cohort and a genotype-count-based SPA when combining statistics across cohorts, which has been shown to effectively control type I error rates [17].
Q4: How can I improve the computational efficiency of a phenome-wide rare variant meta-analysis? A key strategy is to decouple the linkage disequilibrium (LD) matrix from specific phenotypes. Methods like Meta-SAIGE use a single, sparse LD matrix that can be reused across all phenotypes in the analysis. This stands in contrast to other methods that require computing a new, phenotype-weighted LD matrix for each trait, which dramatically increases computational load and storage requirements, especially when analyzing hundreds or thousands of phenotypes [17].
Q5: Why is ancestry-matching important in meta-analysis frameworks like transcriptome-wide association studies (TWAS)? Genetic models, especially those predicting gene expression, do not port well across ancestry groups. Using expression prediction models trained on one ancestry (e.g., European) to analyze data from another (e.g., African) can lead to significantly reduced predictive performance and power, and may increase false positives. For accurate, ancestry-aware discovery, it is critical to use ancestry-specific expression prediction models and ancestry-matched LD reference panels [90].
Troubleshooting Guides
Problem: Inability to replicate a rare variant association found in one biobank in another biobank. Solution:
- Check Phenotype Definitions: First, ensure the case/control definitions are harmonized across biobanks. Differences in clinical ascertainment, electronic health record coding, or inclusion criteria can create fundamental heterogeneity.
- Verify Genomic Data Processing: Confirm that variant calling, quality control procedures, and imputation pipelines are comparable between datasets. Differences can introduce batch effects.
- Assess Ancestry and Population Structure: Use genetic principal components to confirm that the ancestry backgrounds of the replication cohort are comparable to the discovery cohort. Population stratification can lead to spurious associations.
- Evaluate Statistical Power: Calculate the statistical power of your replication cohort. For rare variants, the sample size in the replication cohort might simply be too small to detect the effect observed in the larger discovery cohort.
Problem: Severe computational bottlenecks when performing gene-based tests across many phenotypes. Solution:
- Utilize Efficient Software: Employ methods designed for biobank-scale data. The table below compares features of two meta-analysis methods.
- Re-use the LD Matrix: As highlighted in the FAQs, choose a meta-analysis method that allows you to compute and use a single, sparse LD matrix for all phenotypes, rather than a unique matrix per phenotype.
- Collapse Ultrarare Variants: To reduce computational burden and improve power, some methods like SAIGE-GENE+ and Meta-SAIGE collapse ultrarare variants (e.g., those with a minor allele count < 10) within a gene [17].
Table 1: Comparison of Rare Variant Meta-Analysis Methods
| Feature | Meta-SAIGE | MetaSTAAR |
|---|---|---|
| Type I Error Control for Binary Traits | Uses two-level saddlepoint approximation for robust control, especially with case-control imbalance [17] | Can exhibit inflated type I error rates under imbalanced case-control ratios [17] |
| Computational Efficiency | Reuses a single LD matrix across all phenotypes, reducing storage and computation [17] | Requires constructing separate, phenotype-specific LD matrices for each phenotype, which is computationally intensive [17] |
| Primary Tests | Burden, SKAT, SKAT-O [17] | Not specified in search results |
Experimental Protocols & Workflows
Protocol 1: Meta-Analysis Workflow for Rare Variants Using Meta-SAIGE
This protocol outlines the steps for a scalable and accurate rare variant meta-analysis [17].
Step 1: Prepare Summary Statistics per Cohort
- For each participating biobank/cohort, use the SAIGE software to perform single-variant association tests.
- This generates per-variant score statistics (S), their variances, and association p-values, while adjusting for sample relatedness and case-control imbalance.
- Generate a sparse linkage disequilibrium (LD) matrix (Ω) for the genomic regions of interest. This matrix is not phenotype-specific and can be reused.
Step 2: Combine Summary Statistics
- Consolidate the per-variant score statistics from all cohorts.
- For binary traits, recalculate the variance of each score statistic by inverting the SAIGE p-value to ensure proper standardization.
- Apply the genotype-count-based saddlepoint approximation (SPA) to the combined score statistics to ensure accurate type I error control.
- Calculate the covariance matrix of the score statistics using the formula:
Cov(S) = V^(1/2) * Cor(G) * V^(1/2), whereCor(G)is the variant correlation matrix from the LD matrix.
Step 3: Perform Gene-Based Tests
- Using the combined statistics and covariance matrix, conduct gene-based Burden, SKAT, and SKAT-O tests.
- Collapse ultrarare variants (e.g., MAC < 10) to improve error control and power.
- Optionally, use the Cauchy combination method to combine p-values from tests with different functional annotations and minor allele frequency (MAF) cutoffs.
The following diagram illustrates the key stages of this workflow.
Protocol 2: Framework for Multi-Ancestry Meta-Analysis in TWAS
This protocol, derived from the Global Biobank Meta-analysis Initiative (GBMI), provides a guideline for transcriptome-wide association studies in a multi-ancestry setting [90].
Step 1: Train Ancestry-Specific Expression Models
- For each ancestry group of interest (e.g., European, African, East Asian), train genetic predictive models of gene expression using ancestry-matched eQTL reference panels (e.g., with tools like JTI or MOSTWAS).
- Critical Note: Do not use expression models trained on one ancestry to analyze data from another, as this leads to poor portability and reduced predictive performance.
Step 2: Perform Ancestry-Stratified Association Testing
- For each biobank and within each ancestry group, conduct the TWAS using the ancestry-specific expression models and ancestry-matched GWAS summary statistics.
- Use an ancestry-matched LD reference panel to account for differences in linkage disequilibrium structure.
Step 3: Meta-Analyze Effect Sizes
- Meta-analyze the TWAS effect sizes (z-scores) across biobanks and across ancestry groups using inverse-variance weighting.
- This approach has been shown to produce the least test statistic inflation in this context.
The logical flow and key considerations for this multi-ancestry framework are shown below.
The Scientist's Toolkit: Research Reagent Solutions
Table 2: Key Software and Data Resources for Rare Variant Meta-Analysis
| Item | Function & Application | Key Features |
|---|---|---|
| Meta-SAIGE Software | A scalable method for rare variant meta-analysis that combines summary statistics from multiple cohorts [17]. | Controls type I error for binary traits; Reuses LD matrices across phenotypes; Performs Burden, SKAT, and SKAT-O tests. |
| SAIGE / SAIGE-GENE+ | Software for single-cohort rare variant association analysis using individual-level data. Used to generate summary statistics for meta-analysis [17]. | Adjusts for sample relatedness and case-control imbalance; Accurate single-variant and gene-based P-values. |
| Ancestry-Matched eQTL Datasets | Reference datasets (e.g., from GTEx) used to train genetic models that predict gene expression for specific ancestry groups [90]. | Essential for multi-ancestry TWAS; Using misaligned ancestries reduces prediction accuracy and power. |
| popEVE AI Model | An artificial intelligence model that predicts the pathogenicity of genetic variants and ranks them by disease severity [39]. | Helps prioritize likely causal rare variants from a long list of candidates; Useful for interpreting results from association studies. |
Frequently Asked Questions
1. What is the fundamental difference between Burden tests and SKAT? Burden tests assume all rare variants in a region are causal and affect the phenotype in the same direction with similar magnitudes. They collapse multiple variants into a single genetic score for association testing. In contrast, SKAT (Sequence Kernel Association Test) is a dispersion-based method that tests for association without assuming uniform effect directions, making it robust when both risk and protective variants exist [76] [45].
2. When should I choose SKAT over a Burden test? SKAT is generally preferred when:
- Your target region contains both protective and deleterious variants
- A substantial proportion of variants are non-causal
- You have unbalanced case-control ratios in your study design
- The biological mechanisms are unknown or complex [91] [76] [45]
3. When might Burden tests outperform SKAT? Burden tests can be more powerful when a large proportion of variants in a region are truly causal and influence the phenotype in the same direction. This scenario often occurs in exome sequencing studies focusing on protein-altering variants predicted to be deleterious [91] [45].
4. Is there a method that combines the advantages of both approaches? Yes, SKAT-O (Optimal SKAT) is a unified approach that optimally combines Burden and SKAT tests using the data itself. It automatically behaves like the Burden test when that is more powerful and like SKAT when that is more powerful [91] [45].
5. How does sample size and study design affect method performance? For balanced case-control designs with small sample sizes (<1,000), Burden tests may have slightly higher power. For larger sample sizes (≥4,000) or unbalanced designs where cases are much fewer than controls, SKAT typically shows superior power. With unbalanced designs, SKAT can achieve >90% power with just 200 cases, whereas Burden tests may require 500+ cases [76].
6. What are the computational requirements for these methods? SKAT is computationally efficient as it only requires fitting the null model without genetic variants. It can analyze genome-wide sequencing data relatively quickly. Recent cloud-based implementations like the STAAR workflow further enhance scalability for large whole-genome sequencing studies [92] [46] [50].
Troubleshooting Guides
Problem: Inflated Type I Error Rates
Potential Causes and Solutions:
- Case-Control Imbalance: SKAT can show inflated type I error with highly unbalanced designs
- Solution: Use methods with saddlepoint approximation (SPA) like SAIGE or Meta-SAIGE that specifically address this issue [17]
- Small Sample Sizes: Both methods can be conservative with small samples
- Solution: Implement small-sample adjustments available in SKAT-O and related methods [45]
- Population Stratification: Not adequately adjusting for covariates
Problem: Low Statistical Power
Diagnosis and Solutions:
- Check Your Study Design:
- For SKAT: Ensure sufficient case numbers (>200 for unbalanced designs)
- For Burden tests: Ensure variants are primarily causal with consistent effect directions [76]
Variant Filtering and Weighting:
Method Selection:
Problem: Handling Unbalanced Case-Control Ratios
For SKAT Analysis:
- Use SPA-adjusted implementations like SAIGE-GENE+ or Meta-SAIGE
- Ensure adequate case numbers rather than just large total sample size
- For meta-analysis, use methods specifically designed for unbalanced designs [17]
For Burden Test Analysis:
- Be aware that power is primarily driven by the number of cases
- Consider sample size ratios when interpreting results [76]
Performance Comparison in Different Scenarios
Table 1: Method Performance Across Study Designs
| Scenario | Recommended Method | Key Considerations | Expected Power |
|---|---|---|---|
| Balanced Case-Control | SKAT-O or Burden | Burden better for small samples (<1000), SKAT better for larger samples | High with proper sample size |
| Unbalanced Case-Control | SKAT or SKAT-O | SKAT maintains power with fewer cases; ~200 cases can yield >90% power | Moderate to High |
| Mixed Effect Directions | SKAT | Robust to presence of both risk and protective variants | High |
| Primarily Deleterious Variants | Burden | Most powerful when all variants have same effect direction | High |
| Small Sample Sizes | SKAT-O with small-sample adjustment | Prevents conservative type I error | Low to Moderate |
| Large-Scale WGS | STAAR workflow | Cloud-based implementation efficient for big data | Variable |
Table 2: Sample Size Requirements for 90% Power (Unbalanced Design with 10,000 Controls)
| Method | Required Cases | Odds Ratio | MAF Threshold |
|---|---|---|---|
| SKAT | ~200 | 2.5 | 0.01 |
| Burden Test | ~500-1000 | 2.5 | 0.01 |
| SKAT | ~200 | 2.5 | 0.05 |
| Burden Test | ~500 | 2.5 | 0.05 |
Experimental Protocols
Protocol 1: Implementing SKAT Analysis
Materials Required:
- Genetic data in VCF or GDS format
- Phenotype data with covariates
- Functional annotation databases (e.g., FAVOR)
Step-by-Step Workflow:
- Data Preparation: Convert genetic data to GDS format; ensure quality control
- Null Model Fitting: Regress phenotype on covariates only using generalized linear mixed model to account for relatedness
- Kernel Calculation: Compute weighted genetic similarity matrix using variant-specific weights
- Score Test: Calculate variance component test statistic
- P-value Computation: Obtain p-values using Davies method or saddlepoint approximation [92] [50]
SKAT Analysis Workflow
Protocol 2: Burden Test Implementation
Materials Required:
- Collapsed variant set (e.g., by gene or region)
- Weighting scheme (e.g., MAF-dependent weights)
Step-by-Step Workflow:
- Variant Collapsing: Aggregate rare variants into a single burden score per subject
- Weight Application: Apply functional or MAF-based weights (e.g., Beta(MAF,1,25))
- Association Testing: Test burden score using regression (linear or logistic)
- Significance Evaluation: Compute p-values using asymptotic distributions [91] [45]
Research Reagent Solutions
Table 3: Essential Tools for Rare Variant Analysis
| Tool Name | Type | Function | Implementation |
|---|---|---|---|
| STAAR WDL Workflow | Computational Pipeline | Cloud-based rare variant analysis with functional annotations | Terra Platform [92] |
| SAIGE-GENE+ | Software | Rare variant tests accounting for sample relatedness | R package [17] |
| Meta-SAIGE | Software | Rare variant meta-analysis across cohorts | R package [17] |
| FAVOR Database | Functional Annotation | Provides variant functional scores for weighting | Online database [92] |
| CADD/REVEL | Functional Prediction | Scores variant deleteriousness for prioritization | Standalone tools [93] |
| GDS Format | Data Format | Efficient storage of genetic data for large studies | R/Bioconductor [92] |
Method Selection Workflow
Method Selection Decision Tree
Key Recommendations for Variant Selection in Thesis Research
For Candidate Gene Studies: Prioritize SKAT-O when the underlying genetic architecture is unknown, as it provides robust performance across different scenarios [45].
For Whole-Genome Sequencing: Implement annotation-informed methods like STAAR that incorporate functional data to boost power for true associations [92].
For Meta-Analysis: Use Meta-SAIGE for combining results across studies, particularly for binary traits with unbalanced case-control ratios [17].
For Studies with Related Samples: Always use methods that account for relatedness through genetic relationship matrices in the null model [92] [17].
When Functional Annotation is Available: Leverage tools that incorporate variant pathogenicity predictions (CADD, REVEL) as weights to improve discovery power [93].
Frequently Asked Questions (FAQs)
Q1: How does popEVE differ from previous variant effect prediction models like EVE? popEVE represents a significant evolution from previous models. While its predecessor, EVE, was a powerful generative model that used deep evolutionary information to predict how variants affect protein function, its scores were not easily comparable across different genes. popEVE integrates EVE's predictions with scores from a protein language model (ESM-1v) and, crucially, calibrates these using human population data from sources like the UK Biobank and gnomAD. This process allows popEVE to place variants on a continuous, proteome-wide spectrum of deleteriousness, enabling direct comparison of a variant in one gene against a variant in another. This is essential for identifying the most likely causal variant in a patient's genome [39] [94].
Q2: My research involves cohorts with diverse ancestries. Does popEVE exhibit population bias? A key advantage of popEVE is its limited to no population bias. The model is designed to use a coarse measure of missense variation ("seen" or "not seen") from population databases rather than relying on allele frequencies, which can carry population structure. Independent analyses have confirmed that popEVE shows minimal bias towards European ancestries, performing as well as population-free methods. This makes it a robust tool for genetic analysis across diverse genetic backgrounds [94].
Q3: Can popEVE be used to analyze data without parental genetic information (singleton cases)? Yes, a major strength of popEVE is its ability to prioritize likely causal variants using only the child's exome data. In tests, the model successfully assessed whether a variant was inherited or occurred randomly (de novo), even without parental genetic information. This capability significantly increases the scope of genetic analysis for rare diseases, especially in cases where trio sequencing is not feasible [94].
Q4: What kind of output does popEVE provide, and how should I interpret the scores? popEVE produces a continuous score for each missense variant that indicates its likelihood of being deleterious. The model is designed so that these scores are comparable across the entire human proteome. In a study of severe developmental disorders, a high-confidence severity threshold was set at -5.056, where variants below this threshold had a 99.99% probability of being highly deleterious and were enriched 15-fold in the patient cohort compared to controls [94].
Q5: Where can I access the popEVE model and run my analyses? The code for popEVE is available on GitHub, and scientists can also access the model via an online portal. The research team is actively working on integrating popEVE scores into existing variant and protein databases such as ProtVar and UniProt for wider accessibility [39] [95].
Troubleshooting Guides
Issue 1: Preparing Input Data for popEVE
Problem: Uncertainty about the correct data format required to run the popEVE model.
Solution: The popEVE framework is designed to be flexible. The core code takes two primary inputs [95]:
- Cross-species model predictions: A file containing predictions for all single amino acid substitutions from a model trained on evolutionary data. The original paper used scores from EVE and ESM-1v.
- Human cohort data: A file indicating whether each variant has been "seen" or "not seen" in a given human cohort of interest. The paper used data from the UK Biobank.
Steps:
- Ensure your variant list includes all possible missense substitutions for your gene(s) of interest.
- Generate or obtain the evolutionary scores (EVE, ESM-1v) for these variants.
- Cross-reference your variant list with your chosen human population database (e.g., gnomAD, UK Biobank) to annotate each variant's presence or absence.
- Format these into the input files as expected by the popEVE code. Example training files can be found in the
datafolder of the official GitHub repository [95].
Issue 2: Resolving Software Dependency Conflicts
Problem: Errors occur when setting up the popEVE environment due to conflicting software packages.
Solution: The popEVE codebase is written in Python and requires specific packages. The developers provide configuration files to create a clean environment.
Steps:
- Use the provided
popeve_env_linux.yml(orpopeve_env_macos.yml) file to create a new Conda environment using the command: - Activate the new environment with:
- This environment will include the correct versions of key dependencies such as
pytorch,gpytorch, andpandas[95]. - For a clean Ubuntu 24.04 system, a bash script (
linux_setup.sh) is also available to install all necessary dependencies [95].
Issue 3: Interpreting Results in a Clinical Context
Problem: Determining how to translate popEVE's quantitative scores into actionable insights for variant prioritization.
Solution: Use the popEVE score as a continuous measure of variant deleteriousness to rank and filter variants.
Steps:
- Rank variants: Sort all missense variants in your patient's genome by their popEVE score (from most to least deleterious).
- Apply a threshold: For severe, childhood-onset disorders, prioritize variants falling below the high-confidence severity threshold (e.g., -5.056 as identified in the SDD cohort) [94].
- Cross-reference with phenotype: Filter the top-ranked deleterious variants against the patient's clinical phenotype and the known function of the affected genes.
- Independent validation: Remember that computational predictions, including popEVE's, should be considered as strong evidence for prioritization. Findings should be confirmed through established clinical pathways, such as functional studies or independent segregation analysis [39].
Experimental Protocols & Data
popEVE Model Architecture and Validation Workflow
The following diagram illustrates the integrated data sources and computational workflow of the popEVE model.
Protocol: Benchmarking popEVE Performance
This protocol outlines the key steps used to validate popEVE's performance as described in the foundational research [39] [94].
1. Objective: To evaluate the accuracy of popEVE in distinguishing pathogenic from benign variants and its ability to identify novel disease genes.
2. Materials and Input Data:
- Test Cohorts:
- Benchmark Data: Curated sets of known pathogenic and benign variants from ClinVar.
- Software: popEVE model (available via GitHub or web portal).
3. Methodology:
- Step 1 - Score Variants: Run popEVE on all missense variants in the SDD cohort and control cohorts.
- Step 2 - Case-Control Enrichment: Compare the distribution of popEVE scores in cases versus controls. Assess the enrichment of highly deleterious scores in the affected individuals.
- Step 3 - Novel Gene Discovery: In undiagnosed cases, identify genes harboring de novo missense variants with highly deleterious popEVE scores that are not previously associated with disease.
- Step 4 - Clinical Correlation: Collaborate with clinical partners to independently validate the novel candidate genes.
4. Expected Output:
- A ranked list of variants by deleteriousness score.
- Quantified enrichment of deleterious variants in cases vs. controls.
- A list of novel candidate disease genes for further validation.
Performance Metrics and Comparative Analysis
The table below summarizes key quantitative results from the popEVE validation study, demonstrating its performance in a real-world rare disease cohort [94] [96].
Table 1: popEVE Performance in Severe Developmental Disorder (SDD) Cohort Analysis
| Metric | Result | Context and Comparison |
|---|---|---|
| Diagnostic Yield | ~33% of cases | Led to a diagnosis in about one-third of previously undiagnosed cases in the SDD cohort [39]. |
| Novel Candidate Genes | 123 genes | Identified novel genes linked to developmental disorders; 25 were independently confirmed by other labs [39] [94]. |
| Enrichment of Deleterious Variants | 15-fold | Variants below the high-confidence threshold were 15 times more common in the SDD cohort than expected [94]. |
| Specificity in Controls | 99.8% | Only 0.2% of healthy controls carried variants with equivalently severe popEVE scores [96]. |
The Researcher's Toolkit: popEVE Framework Components
Table 2: Essential Components for the popEVE Analysis Framework
| Research Reagent / Resource | Type | Function in the popEVE Workflow |
|---|---|---|
| EVE Model | Computational Model | A variational autoencoder (VAE) that uses deep evolutionary information from multiple sequence alignments (MSA) to predict the functional impact of missense variants [97]. |
| ESM-1v | Computational Model | A protein language model that learns from amino acid sequences to assess variant effects, providing orthogonal evidence to EVE [94] [98]. |
| UK Biobank / gnomAD | Population Database | Provides large-scale human genetic variation data used to calibrate evolutionary scores and achieve a human-specific measure of constraint across the proteome [94] [95]. |
| ClinVar | Clinical Database | A public archive of reported variant-pathogenicity relationships, used as a benchmark for training and validating the model's classification accuracy [39] [97]. |
GitHub Repository (debbiemarkslab/popEVE) |
Software | Contains the core Python code for training the popEVE model, with dependencies on PyTorch and GPyTorch [95]. |
Variant Prioritization Logic for Rare Disease Research
This flowchart provides a practical decision-making guide for using popEVE in a rare variant analysis pipeline.
FAQs: Navigating Rare Variant Analysis
FAQ 1: What are the primary statistical challenges in rare variant association analysis, and how can they be addressed? The main challenges are controlling type I error rates (false positives) and managing case-control imbalance, especially for low-prevalence binary traits. Methods like Meta-SAIGE address this by using a two-level saddlepoint approximation (SPA) to accurately estimate the null distribution. Furthermore, the winner's curse can cause effect sizes to be overestimated after discovering an association; this bias can be corrected using bootstrap resampling or likelihood-based methods [17] [40].
FAQ 2: When is a gene-based aggregation test more powerful than a single-variant test? Aggregation tests (e.g., Burden, SKAT) are more powerful than single-variant tests only when a substantial proportion of variants in the gene are causal and have effects in the same direction. For instance, if you aggregate all rare protein-truncating variants (PTVs) and deleterious missense variants, aggregation tests become more powerful when PTVs and deleterious missense variants have high probabilities (e.g., 80% and 50%, respectively) of being causal [28].
FAQ 3: How should rare variants be prioritized for functional follow-up studies? Prioritization should be based on statistical significance and biological relevance. Variants with higher minor allele frequencies and larger estimated effect sizes are typically prioritized. Bioinformatic tools are crucial for predicting the impact of variants (e.g., synonymous, missense, nonsense, splicing site) and providing functional annotation (e.g., benign or deleterious). AI models like popEVE can also score variants based on their predicted functional impact and disease severity [37] [39].
FAQ 4: What are the key considerations for replicating a rare variant association? Replication studies require large sample sizes to achieve adequate power. The design should account for the characteristics of the discovered variants, including their minor allele frequencies (MAFs) and estimated effect sizes. A high rate of consistent direction of effect and nominal significance in an independent cohort increases confidence in the association [37] [99].
FAQ 5: Which sequencing strategy is most cost-effective for rare variant studies? Low-depth whole genome sequencing (WGS) is a cost-effective alternative to deep WGS. While it results in higher genotyping error rates, sequencing a larger number of individuals at low depth can provide more power for variant detection and association studies than deep sequencing fewer samples. Whole-exome sequencing (WES) and targeted-region sequencing are also cost-effective options when focusing on coding regions [37] [100].
Troubleshooting Guides
Issue 1: Inflated Type I Error in Binary Trait Analysis
- Problem: Your analysis of a low-prevalence binary trait (e.g., a disease with 1% prevalence) shows inflated type I error rates.
- Diagnosis: This is a common issue when case-control ratios are highly imbalanced and standard methods fail to accurately estimate the null distribution [17].
- Solution:
Issue 2: Discrepancy Between Single-Variant and Aggregation Test Results
- Problem: A gene shows a significant signal in a burden test but not in single-variant tests, or vice versa.
- Diagnosis: This often reflects the underlying genetic architecture. Burden tests are powerful when most aggregated variants are causal and have effects in the same direction. In contrast, single-variant tests can detect signals from individual variants with strong effects, even if they are the only causal variant in a gene [28].
- Solution:
Issue 3: Overestimation of Effect Sizes for Significant Associations
- Problem: The estimated effect size for a significant rare variant association is likely inflated—a phenomenon known as the winner's curse.
- Diagnosis: This is an expected statistical bias that occurs when effect estimation is performed on the same data used for hypothesis testing [40].
- Solution: Apply bias-correction techniques before designing follow-up experiments. Effective methods include:
- Bootstrap resampling
- Likelihood-based approaches [40]
Issue 4: Low Power in Gene-Based Association Tests
- Problem: Your gene-based collapsing analysis lacks power to detect associations.
- Diagnosis: Power may be low due to an insufficient number of variant carriers, mis-specified variant masks (including too many neutral variants), or heterogeneous effect directions [99] [28].
- Solution:
- Increase sample size through meta-analysis (e.g., using Meta-SAIGE) [17].
- Use a more refined variant mask. Focus on loss-of-function (LoF) and deleterious missense variants, which have a higher prior probability of being functional [99] [102].
- For quantitative traits, consider an extreme-phenotype sampling design to increase efficiency [100].
Data Presentation: Key Statistical Tests for Rare Variants
Table 1: Comparison of Primary Rare Variant Association Tests
| Test Type | Key Principle | Best Use Case | Strengths | Weaknesses |
|---|---|---|---|---|
| Burden Test [101] | Collapses variants into a single genetic score per individual. | All/most variants are causal and have effects in the same direction. | High power when assumptions are met. | Power loss with presence of non-causal variants or mixed effect directions. |
| Variance-Component Test (e.g., SKAT) [101] | Models the distribution of variant effects, allowing for different directions. | Presence of both risk and protective variants; heterogeneous effect sizes. | Robust to mixed effect directions. | Lower power when all variants have similar effect directions. |
| Combined Test (e.g., SKAT-O) [17] [101] | Optimally combines burden and variance-component tests. | Genetic architecture is unknown. | Robust power across various scenarios. | Computationally more intensive than individual tests. |
Experimental Protocols for Functional Validation
Protocol: Gene-Based Burden Test Using a LoF Mask
Application: To test if a cumulative burden of predicted high-impact variants in a gene is associated with a phenotype.
Methodology:
- Variant Qualification: Identify all rare (e.g., MAF < 0.1%) variants within the gene of interest. From these, select only those predicted to have severe functional consequences, typically protein-truncating variants (PTVs) such as nonsense, frameshift, and essential splice-site variants [99] [102].
- Collapsing: For each individual, create a binary variable (or a weighted count) indicating the presence or absence of any qualifying PTV in the gene.
- Association Testing: Regress the phenotype on this collapsed burden variable using a regression model (e.g., linear, logistic).
- Covariate Adjustment: Adjust for relevant covariates such as age, sex, and genetic principal components to control for population stratification.
- Significance Threshold: Apply a multiple testing correction. For exome-wide tests, a significance level of ( P < 3.4 \times 10^{-10} ) has been used [99].
Protocol: Meta-Analysis of Rare Variants Using Meta-SAIGE
Application: To combine summary statistics from multiple cohorts to increase power for rare variant discovery.
Methodology [17]:
- Summary Statistics Preparation: For each cohort, use SAIGE to generate per-variant score statistics (S) and a sparse linkage disequilibrium (LD) matrix (Ω). The LD matrix can be reused across different phenotypes to boost computational efficiency.
- Summary Statistics Consolidation: Combine score statistics from all cohorts. For binary traits, recalculate the variance of each score statistic by inverting the SAIGE p-value.
- Type I Error Control: Apply a genotype-count-based saddlepoint approximation (SPA) to the combined score statistics to ensure accurate type I error rates for imbalanced case-control studies.
- Gene-Based Testing: With the combined statistics and covariance matrix, perform Burden, SKAT, and SKAT-O tests. Collapse ultrarare variants (MAC < 10) to enhance power and error control.
- P-Value Combination: Use the Cauchy combination method to combine p-values from tests with different functional annotations and MAF cutoffs.
Workflow Visualization
The following diagram illustrates the core decision-making workflow for a rare variant analysis follow-up, from initial association to functional validation.
Figure 1: Follow-up workflow for genetic associations, guiding from statistical validation to experimental design.
The Scientist's Toolkit: Research Reagent Solutions
Table 2: Essential Resources for Rare Variant Analysis and Follow-Up
| Tool / Reagent | Function / Application | Examples / Notes |
|---|---|---|
| Exome Sequencing [37] | Identifies coding variants across the exome. | Cost-effective for focusing on protein-altering variants. Reagents from Illumina, Agilent, Roche. |
| Exome Chips [100] | Genotypes a predefined set of known exonic variants. | Much cheaper than sequencing, but limited to known variants and poor for very rare variants. |
| Functional Prediction AI [39] | Predicts pathogenicity and disease severity of variants. | popEVE scores variants on a continuous spectrum for likelihood of causing disease. |
| Rare Variant Analysis Software | Performs gene-based association tests. | SAIGE-GENE+/Meta-SAIGE (controls type I error), SKAT/SKAT-O (handles effect heterogeneity). |
| Variant Annotation Databases | Provides functional predictions for genetic variants. | Integrate popEVE scores into databases like ProtVar and UniProt for variant comparison [39]. |
AI and Statistical Models for Variant Prioritization
Question: What computational tools can help prioritize the most likely disease-causing variants from a long list of candidates?
Answer: Several advanced AI and statistical models are now available to help researchers sift through tens of thousands of genetic variants to find the "needles in the haystack." These tools use different underlying methodologies, from deep evolutionary analysis to robust association testing, and are designed to integrate into your analysis workflow. They are particularly crucial for rare variant analysis where single-variant tests are underpowered.
Table: Key Computational Models for Rare Variant Analysis
| Tool Name | Primary Function | Core Methodology | Key Advantage / Application |
|---|---|---|---|
| popEVE [39] [94] | Predicts likelihood of a variant causing disease | Generative AI combining deep evolutionary and human population data [39] [94]. | Provides a proteome-wide calibrated score, enabling comparison of variant severity across different genes [94]. |
| Meta-SAIGE [17] | Rare variant meta-analysis | Scalable method for meta-analysis of gene-based rare variant association tests [17]. | Effectively controls type I error for low-prevalence binary traits and is computationally efficient for phenome-wide analyses [17]. |
| Moon & Apollo (Labcorp) [103] | Variant interpretation at scale | Proprietary AI for scanning variants and a curated gene-phenotype knowledge base [103]. | Useful for high-throughput clinical testing environments, connecting variants to real-world conditions [103]. |
| QCI Interpret [104] | Clinical decision support for variant interpretation | Software integrating automated and manually curated knowledgebases [104]. | Supports hereditary and somatic workflows with features like REVEL and SpliceAI impact predictions [104]. |
Experimental Protocol: Implementing the popEVE Model
Objective: To identify and prioritize deleterious missense variants from whole-exome sequencing data in a research cohort, even in the absence of parental genetic information (singleton cases).
Methodology:
- Input Data Preparation: Prepare a VCF file from your cohort's whole-exome or whole-genome sequencing data.
- Variant Annotation: Annotate all missense variants in the VCF file with pre-computed popEVE scores. Researchers can access popEVE via an online portal [39].
- Score Application and Thresholding:
- Apply popEVE to the annotated variants. The model produces a continuous score for each variant, indicating its likelihood of being deleterious [39].
- To identify high-confidence deleterious variants, use a predefined severity threshold. One established threshold is -5.056, where variants below this score have a 99.99% probability of being highly deleterious [94].
- Prioritization and Analysis:
- Rank all missense variants by their popEVE score.
- Filter and prioritize variants falling below the severity threshold for further investigation.
- Compare the distribution of popEVE scores in case versus control cohorts to assess enrichment of deleterious variants [94].
Troubleshooting Meta-Analysis of Rare Variants
Question: Our rare variant meta-analysis for a binary trait with low prevalence shows inflated type I error. How can we address this?
Answer: Type I error inflation is a known challenge in meta-analysis of rare variants, especially for unbalanced case-control studies. The Meta-SAIGE method was specifically designed to overcome this issue.
Troubleshooting Guide: Meta-Analysis Type I Error
Table: Troubleshooting Steps for Rare Variant Meta-Analysis
| Problem | Potential Cause | Solution / Recommended Tool |
|---|---|---|
| Inflated Type I error for low-prevalence binary traits [17]. | Case-control imbalance and inadequate statistical adjustment. | Use Meta-SAIGE, which employs a two-level saddlepoint approximation (SPA) to accurately estimate the null distribution and control type I error [17]. |
| Inconsistent results across cohorts in a meta-analysis. | Differences in linkage disequilibrium (LD) patterns and population structure. | Apply Meta-SAIGE, which allows the use of a single sparse LD matrix across all phenotypes, improving consistency and computational efficiency [17]. |
| Low power to detect associations in individual cohorts. | Limited cohort size and rare variant frequency. | Perform a meta-analysis to combine summary statistics. Meta-SAIGE has been shown to achieve power comparable to pooled analysis of individual-level data [17]. |
Experimental Protocol: Conducting a Rare Variant Meta-Analysis with Meta-SAIGE
Objective: To identify gene-trait associations by meta-analyzing rare variant association summary statistics from multiple cohorts without pooling individual-level data.
Methodology: Meta-SAIGE is implemented in three main steps [17]:
Summary Statistics Preparation (Per Cohort):
- Use the SAIGE tool to generate per-variant score statistics (S) and their variances for each cohort.
- Generate a sparse linkage disequilibrium (LD) matrix (Ω) for each cohort. This matrix is not phenotype-specific and can be reused across different phenotypes, saving storage and computation [17].
Combining Summary Statistics:
- Combine score statistics from all studies into a single superset.
- For binary traits, the variance of each score statistic is recalculated by inverting the P-value from SAIGE. The Genotype-Count (GC)-based SPA is applied to improve type I error control [17].
- The covariance matrix of the combined score statistics is calculated.
Gene-Based Association Testing:
- With the combined statistics, Meta-SAIGE performs set-based tests (Burden, SKAT, SKAT-O) on genes or regions.
- Ultrarare variants are identified and collapsed to enhance power and control type I error [17].
- P-values from different functional annotations and MAF cutoffs can be combined using the Cauchy combination method.
Variant Interpretation and Clinical Translation
Question: How do we move from a prioritized list of variants to a clinically actionable finding or a novel drug target?
Answer: Translating a variant into a clinically meaningful result requires robust interpretation frameworks and consideration of the broader phenotypic context. This step is critical for both diagnosis and identifying new therapeutic avenues.
Question: A genetic test returns a Variant of Uncertain Significance (VUS). How can we resolve it?
Answer: Resolving a VUS requires gathering additional evidence from multiple sources. Key strategies include:
- Using Advanced Interpretation Tools: Leverage clinical decision support software like QCI Interpret, which integrates publicly available data (e.g., ClinVar) and proprietary curated knowledgebases. These tools can provide evidence for reclassification based on ACMG/AMP guidelines [104].
- Data Sharing: Contribute anonymized variant data to public archives like ClinVar. This collective effort helps reveal patterns—if the same VUS is found in multiple patients with similar symptoms, it strengthens the case for pathogenicity [103].
- Functional Studies: While beyond the scope of many clinical labs, experimental validation in model systems remains the gold standard for confirming a variant's pathological effect.
Question: How can genetic findings directly inform drug discovery?
Answer: Pinpointing the genetic origin of a disease directly highlights potential therapeutic targets [39] [105]. For example:
- Target Identification: A gene linked to a rare neurodevelopmental disorder through models like popEVE becomes a candidate for drug development. This could involve small molecule drugs, gene therapies, or antisense oligonucleotides (ASOs) [105].
- Patient Stratification: Genetic diagnoses can identify homogeneous patient populations for clinical trials, increasing the likelihood of detecting a therapeutic effect [103] [105].
- Natural History Studies: Understanding the full spectrum of a newly discovered genetic disorder is essential for designing clinical trials with meaningful endpoints [105].
The Scientist's Toolkit: Essential Research Reagents and Materials
Table: Key Reagents and Resources for Rare Variant Research
| Item / Resource | Function / Application | Example / Note |
|---|---|---|
| Whole Exome/Genome Sequencing Data | Foundation for identifying coding/genome-wide variants. | Used as primary input for tools like popEVE and Meta-SAIGE [105] [94]. |
| Reference Databases | Provides frequency of variants in background populations. | gnomAD: Critical for filtering out common polymorphisms [105]. |
| Clinical Variant Databases | Repository for known variant-disease relationships. | ClinVar: A public resource to compare findings and submit new data [103]. |
| AI Model Scores | Computational prediction of variant impact. | popEVE, REVEL, SpliceAI (the latter two integrated into platforms like QCI Interpret) [104] [94]. |
| Phenotype Data | Clinical information essential for correlating genotype with trait. | Accurate, structured phenotypic data is crucial for gene discovery and diagnosis [106] [105]. |
| Cohort Summary Statistics | Pre-calculated association data for meta-analysis. | The essential input for the Meta-SAIGE pipeline [17]. |
Conclusion
Selecting the right variants is the cornerstone of a successful rare variant analysis. This process, from foundational biology to robust statistical validation, is crucial for unraveling the genetic architecture of both rare and common diseases. The field is rapidly advancing, driven by larger datasets from biobanks, more sophisticated statistical methods, and powerful new AI tools like popEVE that improve diagnostic yield. Future directions will likely involve greater integration of multi-omics data, improved functional annotations, and the development of methods capable of handling ever-increasing sample sizes and more complex phenotypes. For biomedical research, these advances promise to unlock novel therapeutic targets and finally deliver on the potential of precision medicine for patients with rare genetic conditions.
References
- 1. Ultra-rare and common genetic variant analysis converge ... [https://www.nature.com/articles/s41380-022-01621-8]
- 2. Recent advances and challenges of rare variant ... [https://pmc.ncbi.nlm.nih.gov/articles/PMC9582646/]
- 3. Rare variants - Latest research and news [https://www.nature.com/subjects/rare-variants]
- 4. Rare variants: data types and analysis strategies - PMC [https://pmc.ncbi.nlm.nih.gov/articles/PMC8267277/]
- 5. Common, low-frequency, rare, and ultra-rare coding ... [https://link.springer.com/article/10.1007/s00439-021-02397-7]
- 6. A Practical Guide to Clinical Variant Interpretation [https://www.euformatics.com/blog-post/a-practical-guide-to-clinical-variant-interpretation]
- 7. Computational and experimental methods for classifying ... [https://pmc.ncbi.nlm.nih.gov/articles/PMC9059783/]
- 8. New AI model could speed rare disease diagnosis [https://www.broadinstitute.org/news/new-ai-model-could-speed-rare-disease-diagnosis]
- 9. How to Troubleshoot Sequencing Preparation Errors (NGS ... [https://www.cd-genomics.com/resource-sequencing-preparation-troubleshooting.html]
- 10. varCADD: large sets of standing genetic variation enable ... [https://pmc.ncbi.nlm.nih.gov/articles/PMC12323237/]
- 11. An optimized variant prioritization process for rare disease ... [https://pmc.ncbi.nlm.nih.gov/articles/PMC12539062/]
- 12. Bioinformatics Tool Simplifies Identification of Structural ... [https://www.insideprecisionmedicine.com/topics/molecular-dx/bioinformatics-tool-simplifies-identification-of-structural-genetic-variants/]
- 13. Frequently Asked Questions [https://raregenomes.org/frequently-asked-questions]
- 14. FAQ [https://www.variantyx.com/resources/provider-resources/faq/]
- 15. Estimation and mapping of the missing heritability ... [https://www.nature.com/articles/s41586-025-09720-6]
- 16. Rare penetrant mutations confer severe risk of common ... [https://pmc.ncbi.nlm.nih.gov/articles/PMC10187340/]
- 17. Scalable and accurate rare variant meta-analysis with Meta ... [https://www.nature.com/articles/s41588-025-02403-y]
- 18. Functional Annotation of Rare Genetic Variants - NCBI - NIH [https://www.ncbi.nlm.nih.gov/books/NBK539450/]
- 19. Rare variant association studies: considerations, challenges ... [https://pmc.ncbi.nlm.nih.gov/articles/PMC4337325/]
- 20. Rare Variant Analysis and Interpretation [https://www.illumina.com/informatics/biological-interpretation/variant-analysis/rare-variants.html]
- 21. Phenotypic extremes in rare variant study designs [https://www.nature.com/articles/ejhg2015197]
- 22. Detecting Rare Variant Effects Using Extreme Phenotype ... [https://pmc.ncbi.nlm.nih.gov/articles/PMC3601902/]
- 23. Defining Phenotypes from Clinical Data to Drive Genomic ... [https://pmc.ncbi.nlm.nih.gov/articles/PMC8186527/]
- 24. The UK Biobank resource with deep phenotyping and ... [https://www.nature.com/articles/s41586-018-0579-z]
- 25. Yield of genetic association signals from genomes, exomes ... [https://www.nature.com/articles/s41588-024-01930-4]
- 26. Whole Exome vs. Whole Genome Sequencing [https://www.cd-genomics.com/resource-wes-and-wgs.html]
- 27. Genomes vs Exomes - by Veera M. Rajagopal [https://www.gwasstories.com/p/genomes-vs-exomes]
- 28. Rare-variant association studies: When are aggregation ... [https://www.sciencedirect.com/science/article/pii/S0002929725002721]
- 29. Accurate rare variant phasing of whole-genome and whole ... [https://pmc.ncbi.nlm.nih.gov/articles/PMC10335929/]
- 30. Microarray vs Whole-Exome Sequencing (WES) [https://3billion.io/blog/microarray-vs-wes]
- 31. Comparison of Exome and Genome Sequencing ... [https://pmc.ncbi.nlm.nih.gov/articles/PMC4755152/]
- 32. Troubleshooting the gene-variant workflow [https://re-docs.genomicsengland.co.uk/gv_faqs/]
- 33. Chromosomal quality control in hPSCs: A practical guide to ... [https://pmc.ncbi.nlm.nih.gov/articles/PMC12259632/]
- 34. Whole-genome sequencing improves diagnostic yield in ... [https://www.sciencedirect.com/science/article/pii/S2666247725000727]
- 35. Recommendations for bioinformatics in clinical practice [https://genomemedicine.biomedcentral.com/articles/10.1186/s13073-025-01543-4]
- 36. Methods for the analysis and interpretation for rare variants ... [https://pmc.ncbi.nlm.nih.gov/articles/PMC6455968/]
- 37. Rare-Variant Association Analysis: Study Designs and ... [https://pmc.ncbi.nlm.nih.gov/articles/PMC4085641/]
- 38. A statistical framework for multi-trait rare variant analysis in ... [https://pure.johnshopkins.edu/en/publications/a-statistical-framework-for-multi-trait-rare-variant-analysis-in-/]
- 39. New Artificial Intelligence Model Could Speed Rare ... [https://hms.harvard.edu/news/new-artificial-intelligence-model-could-speed-rare-disease-diagnosis]
- 40. Winner's curse in rare variant analysis: effect size ... [https://www.frontiersin.org/journals/genetics/articles/10.3389/fgene.2025.1416673/full]
- 41. Burden Testing of Rare Variants Identified through Exome ... [https://pmc.ncbi.nlm.nih.gov/articles/PMC6174288/]
- 42. Gene-based burden scores identify rare variant associations ... [https://bmcgenomdata.biomedcentral.com/articles/10.1186/s12863-023-01155-0]
- 43. Gene-Based Burden Testing of Rare Variants in Hemiplegic ... [https://pmc.ncbi.nlm.nih.gov/articles/PMC12294318/]
- 44. Rare-variant association studies: When are aggregation ... [https://www.sciencedirect.com/science/article/abs/pii/S0002929725002721]
- 45. Optimal Unified Approach for Rare-Variant Association ... [https://pmc.ncbi.nlm.nih.gov/articles/PMC3415556/]
- 46. Rare-Variant Association Testing for Sequencing Data with ... [https://www.sciencedirect.com/science/article/pii/S0002929711002229]
- 47. Joint testing of rare variant burden scores using non- ... [https://pmc.ncbi.nlm.nih.gov/articles/PMC11480795/]
- 48. Computationally efficient meta-analysis of gene-based ... [https://www.nature.com/articles/s41588-025-02390-0]
- 49. Rare disease gene association discovery in the ... [https://www.nature.com/articles/s41586-025-08623-w]
- 50. Rare-Variant Association Testing for Sequencing Data with ... [https://pmc.ncbi.nlm.nih.gov/articles/PMC3135811/]
- 51. Sequence kernel association test (SKAT) - LawlessGenomics [https://lawlessgenomics.com/topic/skat]
- 52. Robust Rare Variant Association Testing for Quantitative Traits ... [https://pmc.ncbi.nlm.nih.gov/articles/PMC4510991/]
- 53. leelabsg/SKAT: Sequence kernel association test (SKAT) [https://github.com/leelabsg/SKAT]
- 54. Aggregate Variant Testing (AVT) workflow [https://re-docs.genomicsengland.co.uk/avt/]
- 55. Rare variant association studies: Significance, methods ... [https://www.sciencedirect.com/science/article/pii/S106345842401505X]
- 56. Rvtests | Rare variant test software for next generation ... [http://zhanxw.github.io/rvtests/]
- 57. RVTESTS: an efficient and comprehensive tool for rare ... [https://pmc.ncbi.nlm.nih.gov/articles/PMC4848408/]
- 58. The Aggregrate Variant Testing workflow [https://re-docs.genomicsengland.co.uk/avt2/]
- 59. Home | SAIGE [https://saigegit.github.io/SAIGE-doc/]
- 60. SAIGE GWAS Walkthrough [https://documentation.dnanexus.com/science/scientific-guides/saige-gwas-walkthrough]
- 61. Issue running SAIGE on dataset with missing dosages? #131 [https://github.com/weizhouUMICH/SAIGE/issues/131]
- 62. Controlling for human population stratification in rare variant ... [https://pmc.ncbi.nlm.nih.gov/articles/PMC8463695/]
- 63. SPC: a SPectral Component approach to address recent ... [https://www.medrxiv.org/content/10.1101/2025.06.04.25328990v1.full-text]
- 64. Rare-Variant Genome-Wide Association and Polygenic ... [https://www.mdpi.com/1422-0067/26/19/9481]
- 65. New approaches to population stratification in genome- ... [https://pmc.ncbi.nlm.nih.gov/articles/PMC2975875/]
- 66. Population Stratification - an overview | ScienceDirect Topics [https://www.sciencedirect.com/topics/medicine-and-dentistry/population-stratification]
- 67. Integrating comprehensive functional annotations to boost ... [https://pmc.ncbi.nlm.nih.gov/articles/PMC7737906/]
- 68. Leveraging functional annotations to map rare variants ... [https://www.sciencedirect.com/science/article/abs/pii/S0002929725002861]
- 69. A statistical framework for multi-trait rare variant analysis in ... [https://pmc.ncbi.nlm.nih.gov/articles/PMC11981678/]
- 70. Integration of variant annotations using deep set networks ... [https://www.nature.com/articles/s41588-024-01919-z]
- 71. The Value of Statistical or Bioinformatics Annotation for ... [https://pmc.ncbi.nlm.nih.gov/articles/PMC4083762/]
- 72. Leveraging functional annotations to map rare variants ... [https://pmc.ncbi.nlm.nih.gov/articles/PMC11643288/]
- 73. Efficiently controlling for case-control imbalance and ... [https://pmc.ncbi.nlm.nih.gov/articles/PMC6119127/]
- 74. An evaluation of approaches for rare variant association ... [https://www.nature.com/articles/s41598-021-82547-z]
- 75. Recent advances and challenges of rare variant ... [https://www.frontiersin.org/journals/genetics/articles/10.3389/fgene.2022.1014947/full]
- 76. Real world scenarios in rare variant association analysis [https://bmcbioinformatics.biomedcentral.com/articles/10.1186/s12859-018-2591-6]
- 77. Mathematical bounds on r2 and the effect size in case- ... [https://www.sciencedirect.com/science/article/abs/pii/S0040580925000280]
- 78. Why are rare variants hard to impute? Coalescent models ... [https://pmc.ncbi.nlm.nih.gov/articles/PMC8049559/]
- 79. Imputing rare variants in families using a two-stage approach [https://pmc.ncbi.nlm.nih.gov/articles/PMC5133481/]
- 80. Article Imputation accuracy across global human populations [https://www.sciencedirect.com/science/article/pii/S0002929724000843]
- 81. Establishing Best Practices for Clinical GWAS - PubMed Central [https://pmc.ncbi.nlm.nih.gov/articles/PMC12250051/]
- 82. Rare variant analyses in 51256 type 2 diabetes cases and ... [https://www.nature.com/articles/s41588-024-01947-9]
- 83. The hazards of genotype imputation when mapping disease ... [https://genomebiology.biomedcentral.com/articles/10.1186/s13059-023-03140-3]
- 84. Optimizing genotype imputation strategy for low-coverage ... [https://www.sciencedirect.com/science/article/pii/S2352513425002121]
- 85. High Imputation Accuracy Can Be Achieved Using a Small ... [https://pmc.ncbi.nlm.nih.gov/articles/PMC12550488/]
- 86. Explicable prioritization of genetic variants by integration ... [https://pmc.ncbi.nlm.nih.gov/articles/PMC10956189/]
- 87. Deep structured learning for variant prioritization in ... [https://www.nature.com/articles/s41467-023-39306-7]
- 88. Scientists uncover rare gene variants that help people live past 100 [https://www.news-medical.net/news/20250326/Scientists-uncover-rare-gene-variants-that-help-people-live-past-100.aspx]
- 89. FAQ & Troubleshooting [https://docs.varsome.com/en/faq-troubleshooting]
- 90. Best practices for multi-ancestry, meta-analytic ... [https://pmc.ncbi.nlm.nih.gov/articles/PMC9631681/]
- 91. Optimal tests for rare variant effects in sequencing association ... [https://pmc.ncbi.nlm.nih.gov/articles/PMC3440237/]
- 92. a cloud-based workflow for scalable and reproducible rare ... [https://pmc.ncbi.nlm.nih.gov/articles/PMC9991895/]
- 93. Variant Analysis in Genomic Medicine Workflow [https://www.cd-genomics.com/blog/variant-analysis-genomic-medicine-workflow.html]
- 94. Proteome-wide model for human disease genetics [https://www.nature.com/articles/s41588-025-02400-1]
- 95. debbiemarkslab/popEVE [https://github.com/debbiemarkslab/popEVE]
- 96. New PopEVE AI Model Speeds Up Rare Disease Discovery [https://oncodaily.com/industry/popeve]
- 97. 【阅读总结】Variant Effect Predictor: EVE 深度生成模型预测 ... [https://blog.csdn.net/weixin_44728829/article/details/141224242]
- 98. Tranception 自回归预测+ ProteinGym 基准数据集 [https://blog.csdn.net/weixin_44728829/article/details/141370211]
- 99. Genome-wide rare variant analysis for thousands of ... [https://www.nature.com/articles/s41467-020-14288-y]
- 100. Rare variant association studies: considerations, challenges ... [https://genomemedicine.biomedcentral.com/articles/10.1186/s13073-015-0138-2]
- 101. Rare variants: data types and analysis strategies - Goswami [https://atm.amegroups.org/article/view/69229/html]
- 102. Rare genetic variants confer a high risk of ADHD and ... [https://www.nature.com/articles/s41586-025-09702-8]
- 103. Can variant interpretation at scale unlock faster answers for ... [https://www.statnews.com/sponsor/2025/10/27/can-variant-interpretation-at-scale-unlock-faster-answers-for-rare-disease-patients/]
- 104. New QCI Interpret 2025 Release enhances variant filtering, ... [https://digitalinsights.qiagen.com/news/blog/clinical/qci-interpret-2025-release/]
- 105. Precision diagnostic and therapeutic interventions in rare ... [https://www.nature.com/articles/s41390-025-04611-y]
- 106. Rare Research Report: July 2025 [https://www.rarediseasesnetwork.org/node/968]